Fig. 3
Download original image
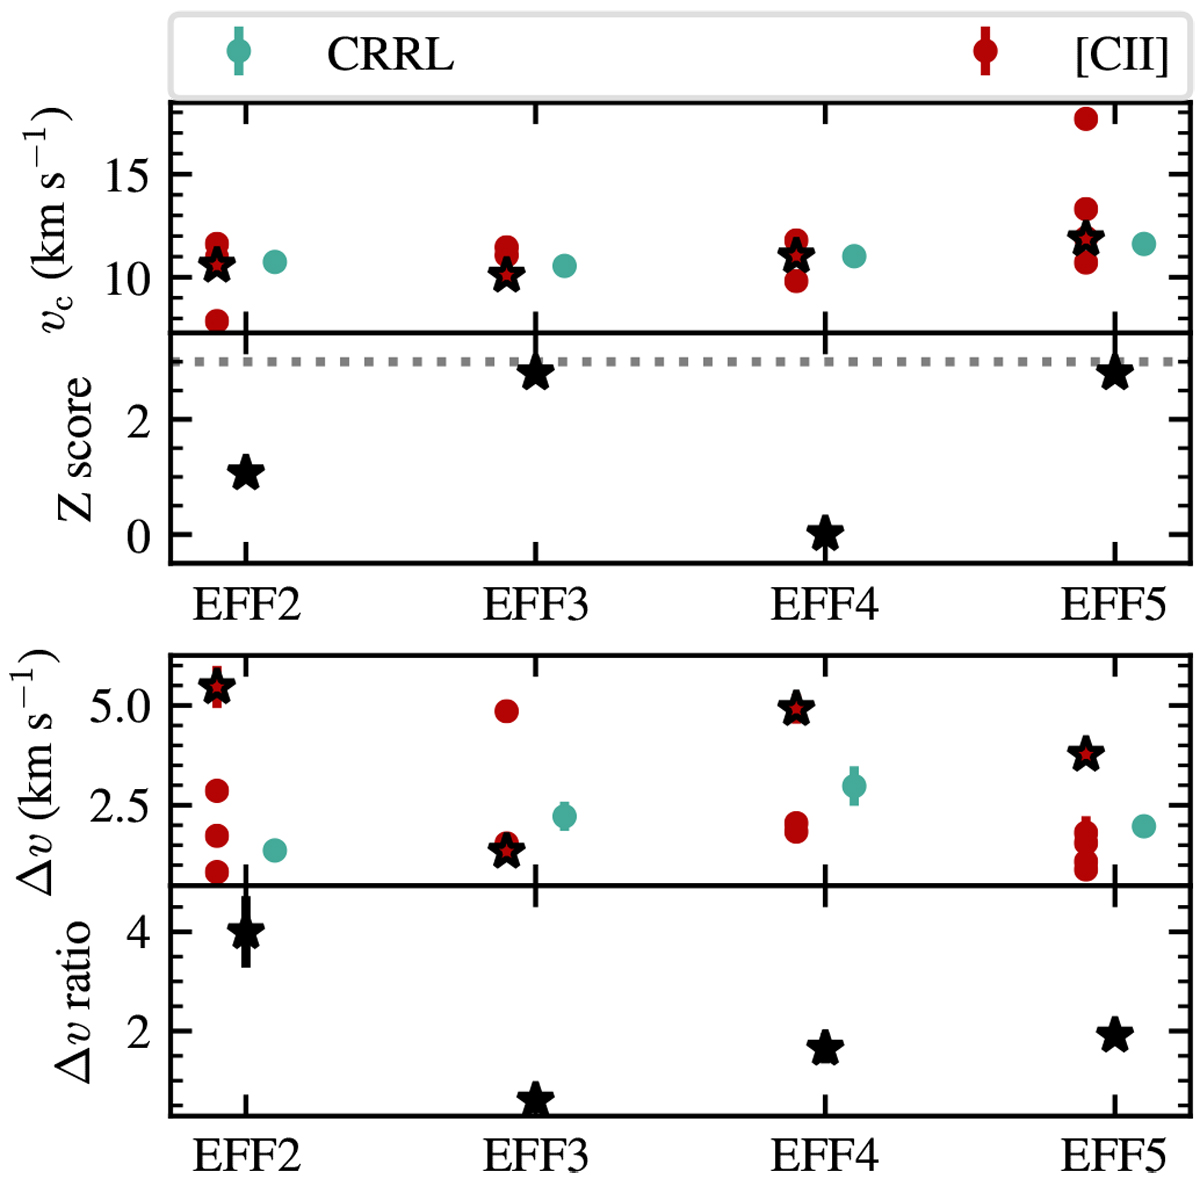
Comparison between the velocity centroids, vc, and line widths, Δv, of the [CII] and CRRL line profiles. vc and Δv are determined from a multicomponent Gaussian fit to the observed spectra (Fig. 2). The top panel shows the velocity centroids, the upper middle panel shows the difference between the closest velocity centroids in units of its error, Z score, the lower middle panel shows the standard deviation of the Gaussian line profile, and the lower panel shows the ratio Δv([CII])∕Δv([CRRL]). The starred symbols show the [CII] components that are closest in velocity to the CRRLs.
Current usage metrics show cumulative count of Article Views (full-text article views including HTML views, PDF and ePub downloads, according to the available data) and Abstracts Views on Vision4Press platform.
Data correspond to usage on the plateform after 2015. The current usage metrics is available 48-96 hours after online publication and is updated daily on week days.
Initial download of the metrics may take a while.