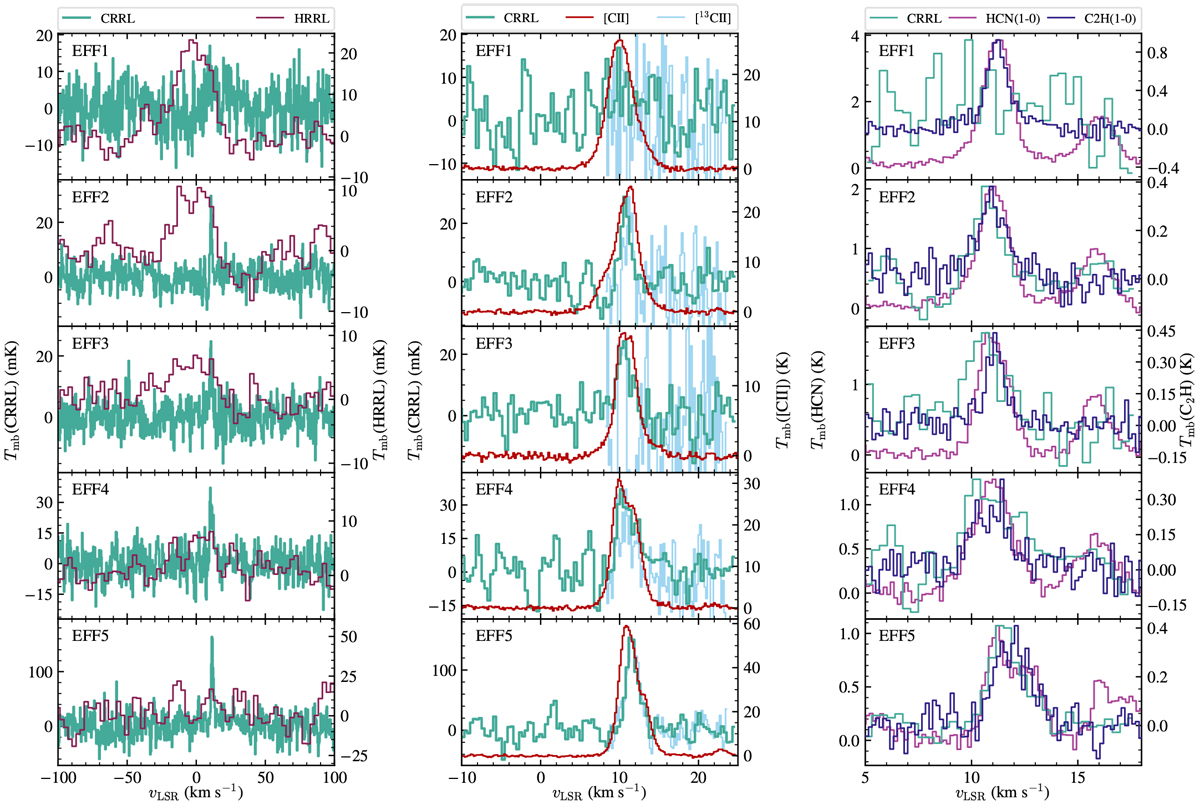
Fig. 2
Download original image
CRRL spectra observed toward the northern part of the ISF with the Effelsberg 100 m radio telescope. The CRRL is an average of the C109α and C102α lines. We compare the averaged CRRL to the averaged HRRL (an average of the H109α and H102α lines, on the left), the FIR [CII] and [13CII] F = 2– 1 lines (center), and HCN(1–0) and C2 H(1–0) (right). In the center panels the [13CII] F = 2– 1 line is scaledto match the peak of the averaged CRRL, while on the right panels the CRRL is scaled to match the peak of the HCN(1–0) line.
Current usage metrics show cumulative count of Article Views (full-text article views including HTML views, PDF and ePub downloads, according to the available data) and Abstracts Views on Vision4Press platform.
Data correspond to usage on the plateform after 2015. The current usage metrics is available 48-96 hours after online publication and is updated daily on week days.
Initial download of the metrics may take a while.