Fig. 1
Download original image
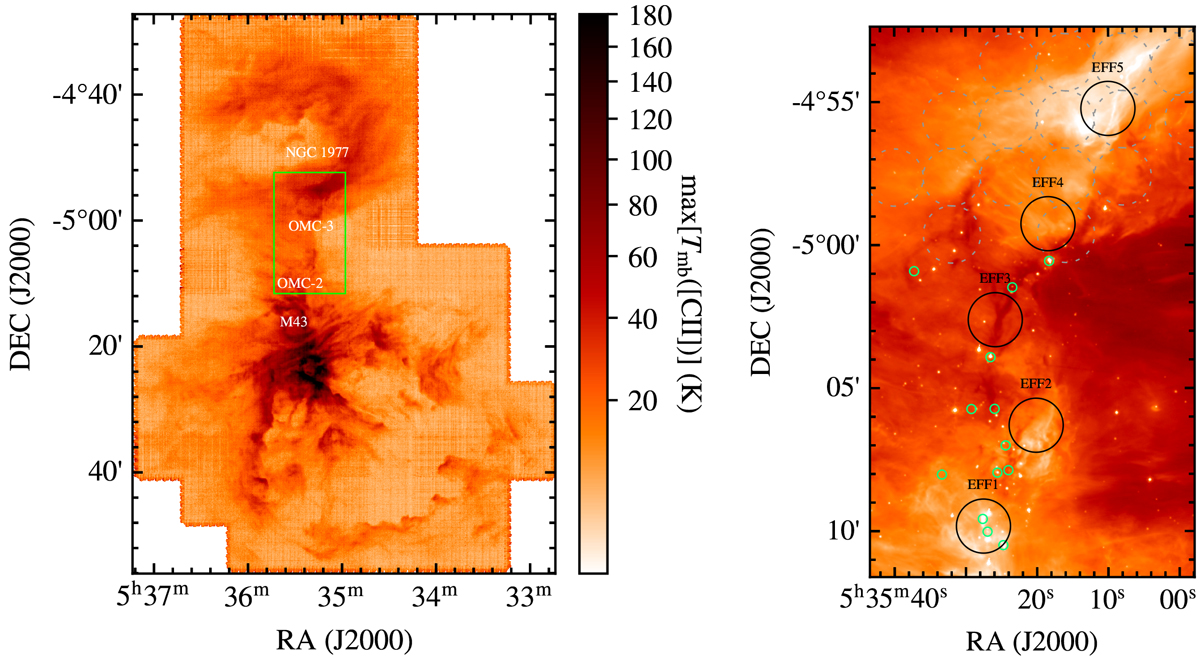
Location of the Effelsberg 5 GHz RRL observations presented in this work. Left: map of the peak temperature of the [CII] line over a one square degree centered on the Trapezium stars (Pabst et al. 2019). A green rectangle shows the extent of the region displayed on the right. Right: Spitzer IRAC 8 μm image of the OMC-2/3. The regions observed in 5 GHz RRLs are marked with solid black circles 1.′89 in diameter, while the dashed gray circles show the C76α observationsof Kutner et al. (1985) at 2′ resolution. The small green circles show the location of the sources detected in 3.6 cm radio continuum (Reipurth et al. 1999).
Current usage metrics show cumulative count of Article Views (full-text article views including HTML views, PDF and ePub downloads, according to the available data) and Abstracts Views on Vision4Press platform.
Data correspond to usage on the plateform after 2015. The current usage metrics is available 48-96 hours after online publication and is updated daily on week days.
Initial download of the metrics may take a while.