Fig. C.1
Download original image
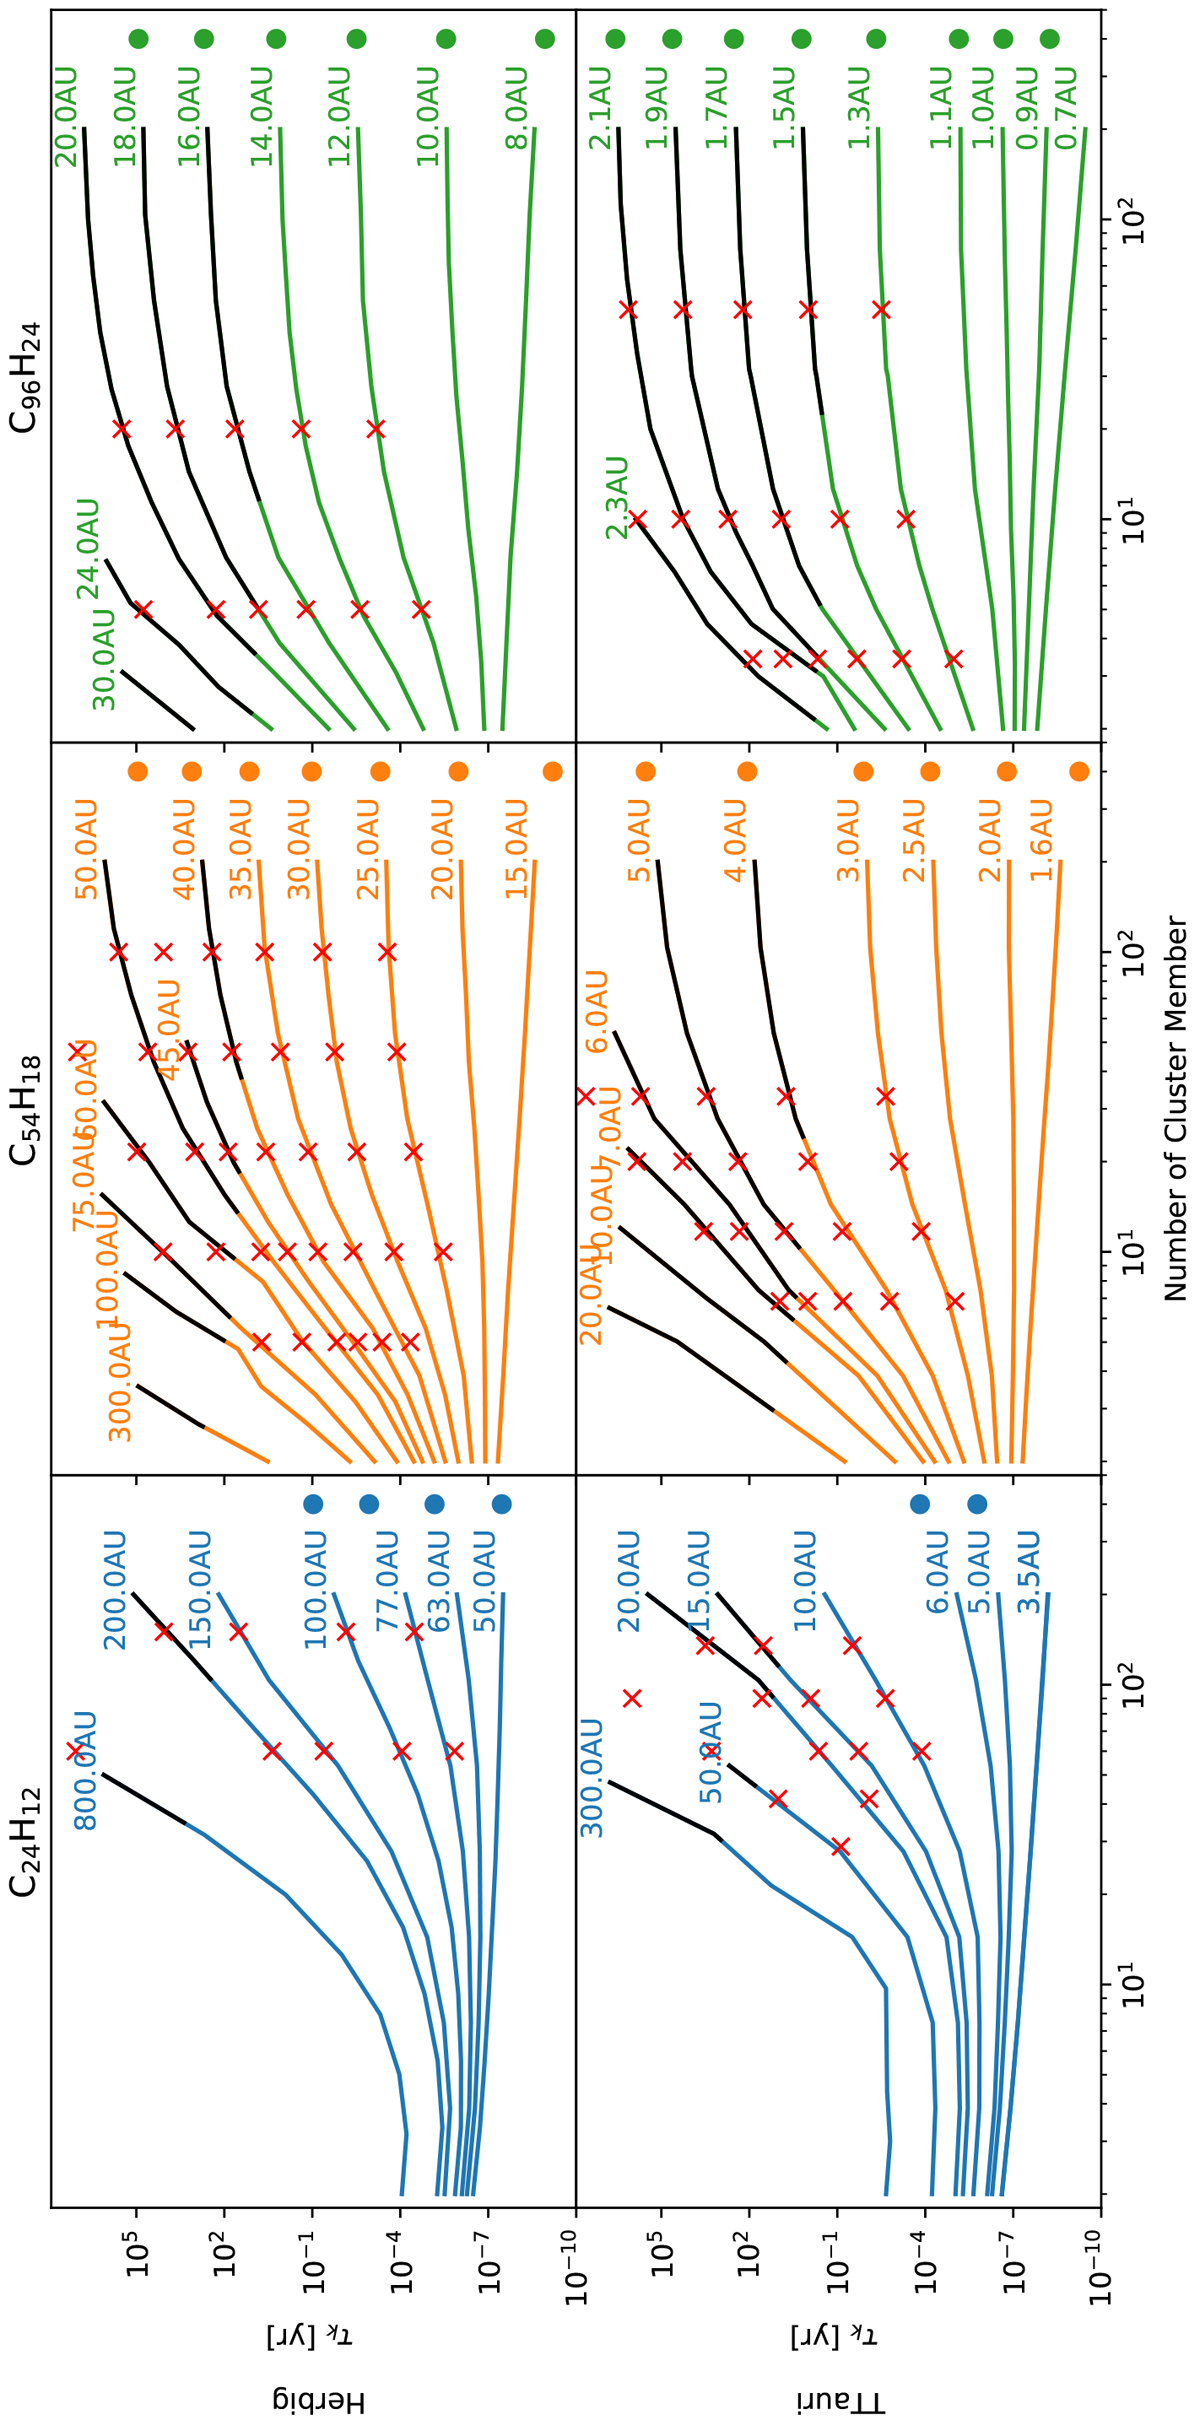
Full plot for Fig. 6. Top row: Herbig model. Bottom row: T Tauri model. From left to right: coronene, circumcoronene, and circumcircumcoronene. Solid lines: values obtained from MC-simulations. Crosses: values obtained from statistical calculations. The transition from coloured lines to black shows the cluster size at which the dissociation timescale of the cluster equals the eddy turnover timescale. We consider the black lines to be stable. The smaller the monomer molecule, the larger the distances required to reach stability and the smaller the stability gain per member molecule. Coronene is too small to be stabilised over 1000 AU in both discs.
Current usage metrics show cumulative count of Article Views (full-text article views including HTML views, PDF and ePub downloads, according to the available data) and Abstracts Views on Vision4Press platform.
Data correspond to usage on the plateform after 2015. The current usage metrics is available 48-96 hours after online publication and is updated daily on week days.
Initial download of the metrics may take a while.