Fig. A.4
Download original image
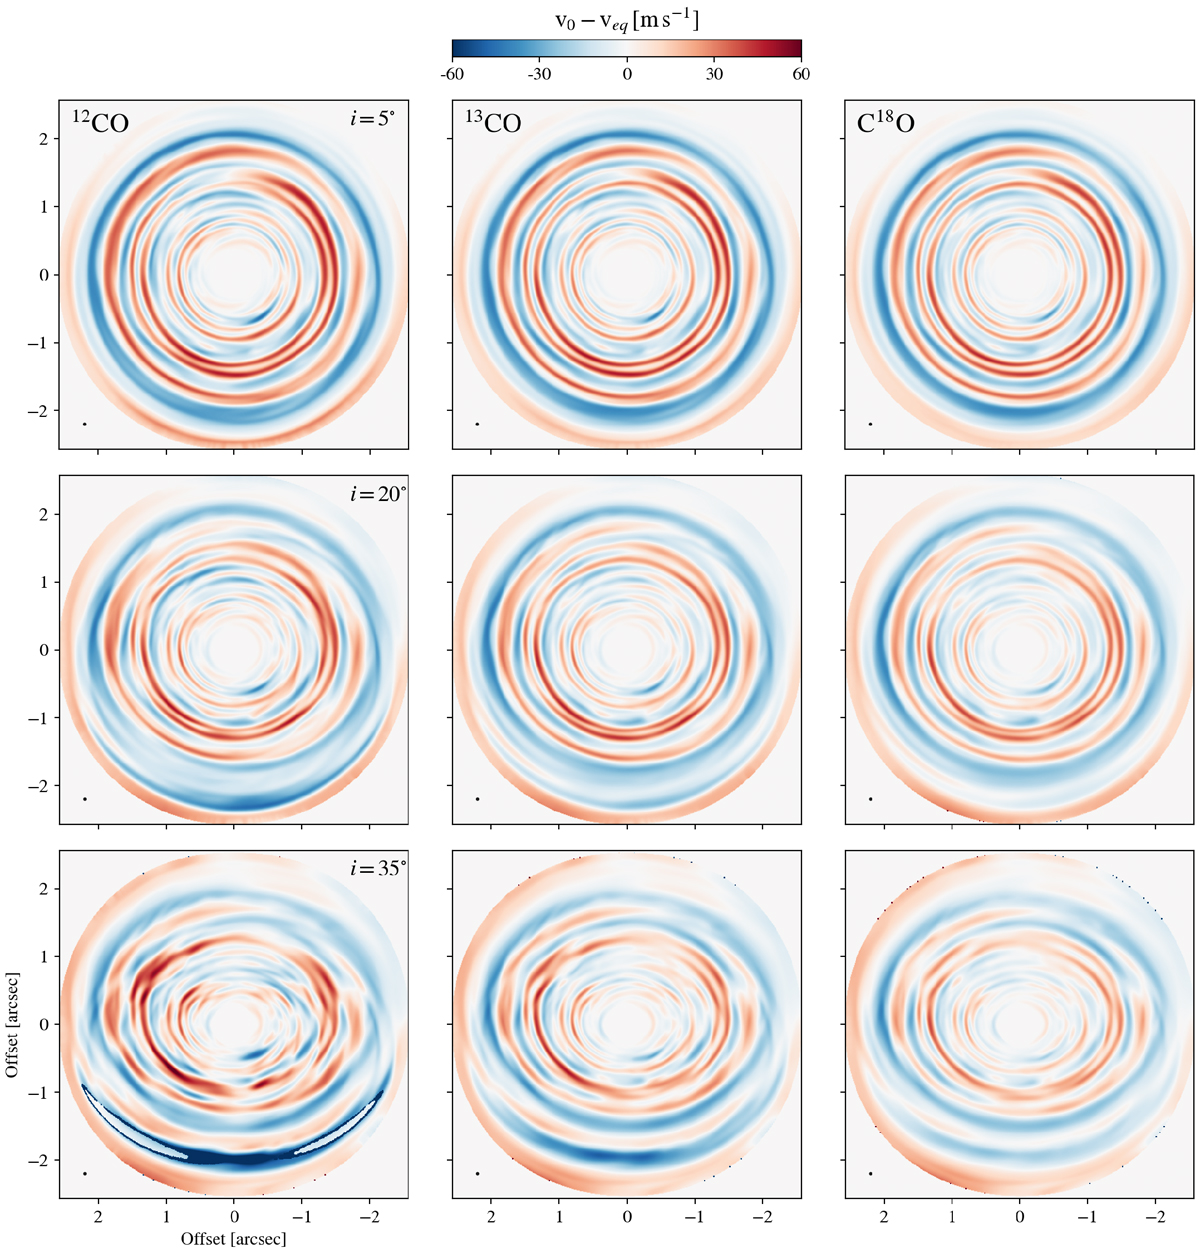
Results of the expected observable velocity perturbations from a VSI unstable disk synthetic lines observations for different CO isotopologues. From left to right, the columns show predictions for 12CO, 13CO and C18O. From top to bottom, the rows show the results for disk inclinations of 5°, 20° and 35°. The mock data cubes have a velocity resolution of 0.05 km s−1, and the images are convolved by a circular Gaussian beam of 50 mas, shown at the bottom left corner of each panel. The x- and y-axes indicate the RA and Dec angular offset from the position of the central star, in arcseconds.
Current usage metrics show cumulative count of Article Views (full-text article views including HTML views, PDF and ePub downloads, according to the available data) and Abstracts Views on Vision4Press platform.
Data correspond to usage on the plateform after 2015. The current usage metrics is available 48-96 hours after online publication and is updated daily on week days.
Initial download of the metrics may take a while.