Fig. 4
Download original image
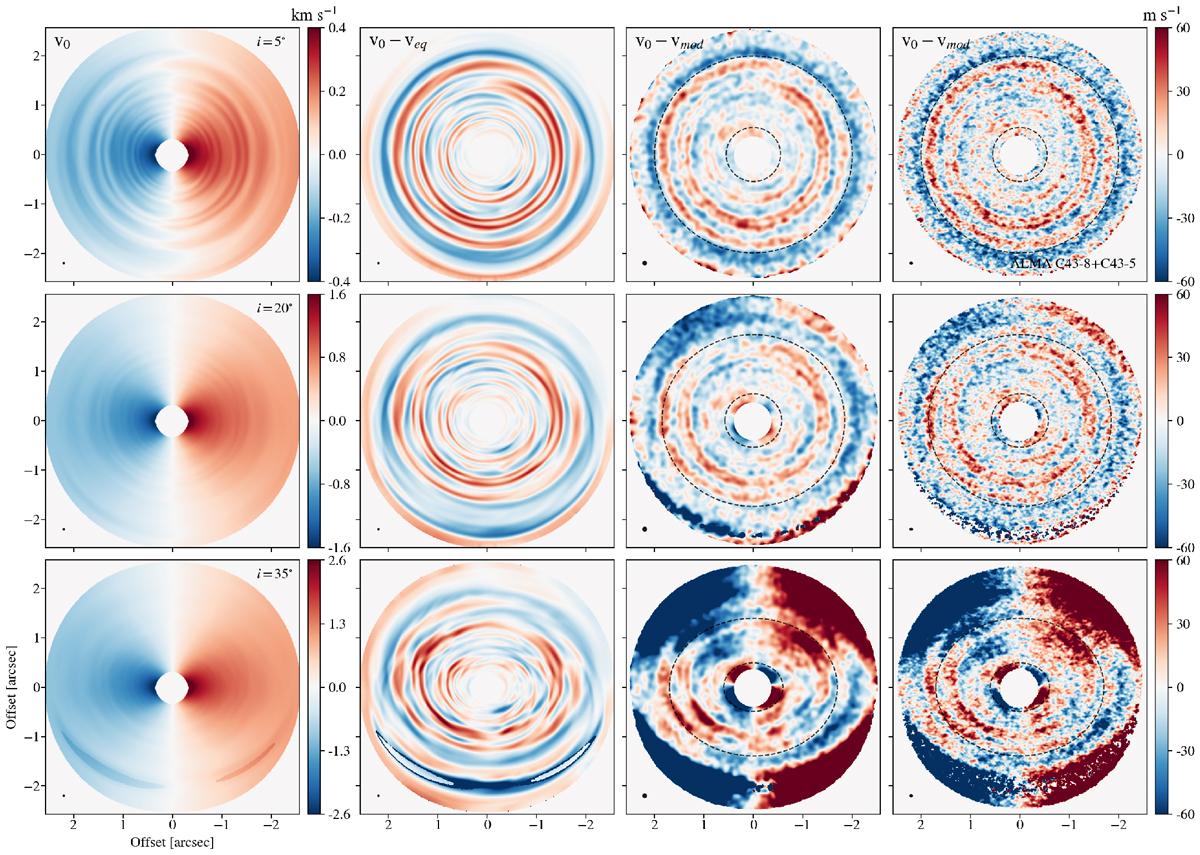
Results of the line of sight velocity map and extracted velocity perturbations from a VSI unstable disk 12CO(2–1) synthetic lines observations. The velocity centroid of the line was computed at each pixel from mock data cubes with a velocity resolution of 0.05 km s−1. The input fields are shown in Fig. 3, which corresponds to a disk after ~ 0.3 Myr of evolution. From top to bottom: results for disk inclinations of 5°, 20° and 35°. First column: velocity centroid maps (v0). The images are convolved by a circular Gaussian beam of 50 mas and have no noise. Second column: residual map of subtracting to v0 the velocity centroid map obtained from a disk following an equilibrium solution (veq). Third column: residual of subtracting to v0 the best fit disk model obtained using EDDY (vmod). The images in this case are convolved by a 0.1 arcseconds circular Gaussian beam and have an RMS noise of ~ 1.5 mJy beam−1. Fourth column: same as the third column, but for a 20 h Cycle 7 ALMA simulated observation using configurations C43-8 and C43-5, with an RMS noise of ~ 1.5 mJy beam−1. The beam size is shown with a black circle at the bottom left of each panel. The black-dotted ellipses in panels of Cols. 3 and 4 are the inner and outer edge of the region considered to obtain the best fit model. The x- and y- axes indicate the RA and Dec angular offset from the central star’s position in arcseconds.
Current usage metrics show cumulative count of Article Views (full-text article views including HTML views, PDF and ePub downloads, according to the available data) and Abstracts Views on Vision4Press platform.
Data correspond to usage on the plateform after 2015. The current usage metrics is available 48-96 hours after online publication and is updated daily on week days.
Initial download of the metrics may take a while.