Open Access
Fig. 1
Download original image
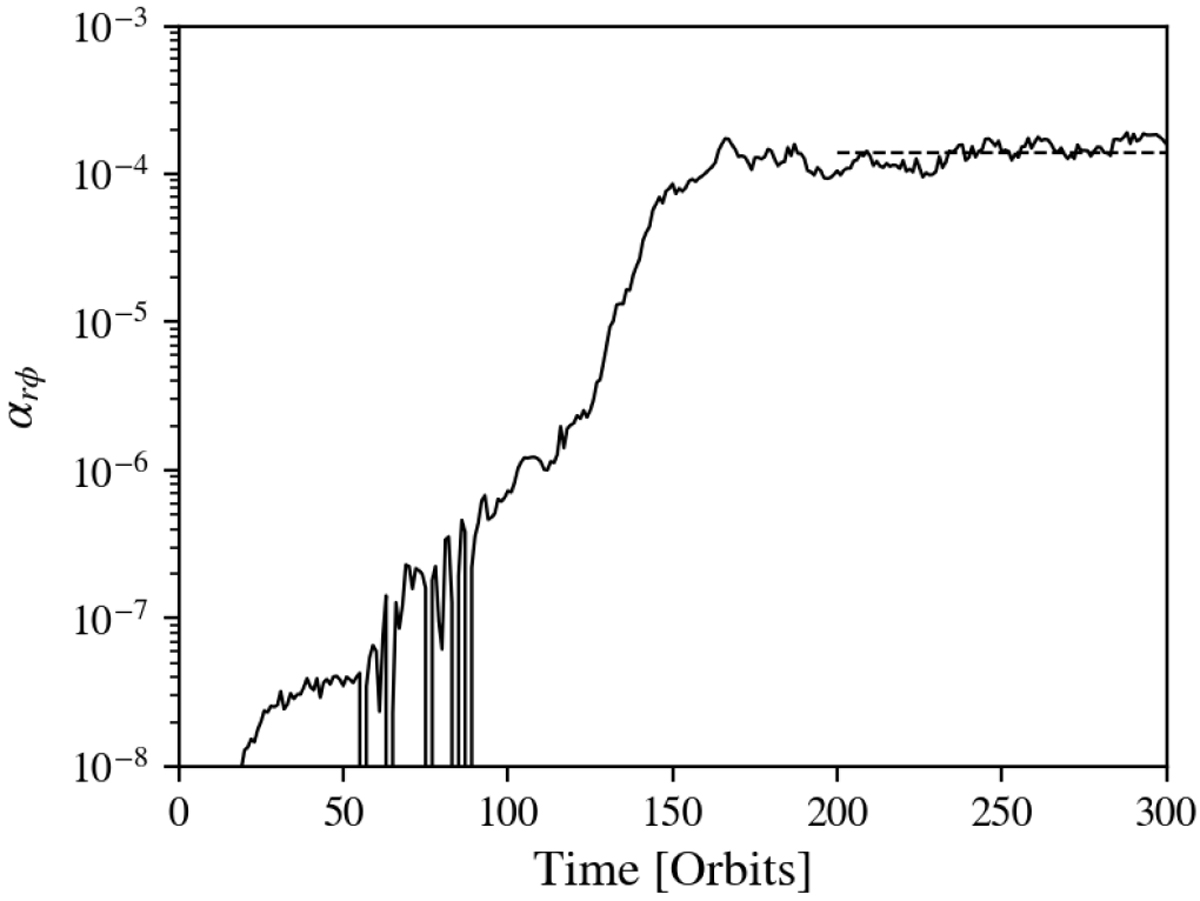
Time evolution of the stress-to-pressure ratio αrϕ of the VSI-unstable 3D hydrodynamical simulation. We show the time evolution in units of the orbital timescale at R = 100 au. The dashed line indicates the time-averaged value of αrϕ between 200 and 300 orbits.
Current usage metrics show cumulative count of Article Views (full-text article views including HTML views, PDF and ePub downloads, according to the available data) and Abstracts Views on Vision4Press platform.
Data correspond to usage on the plateform after 2015. The current usage metrics is available 48-96 hours after online publication and is updated daily on week days.
Initial download of the metrics may take a while.