Fig. 2.
Download original image
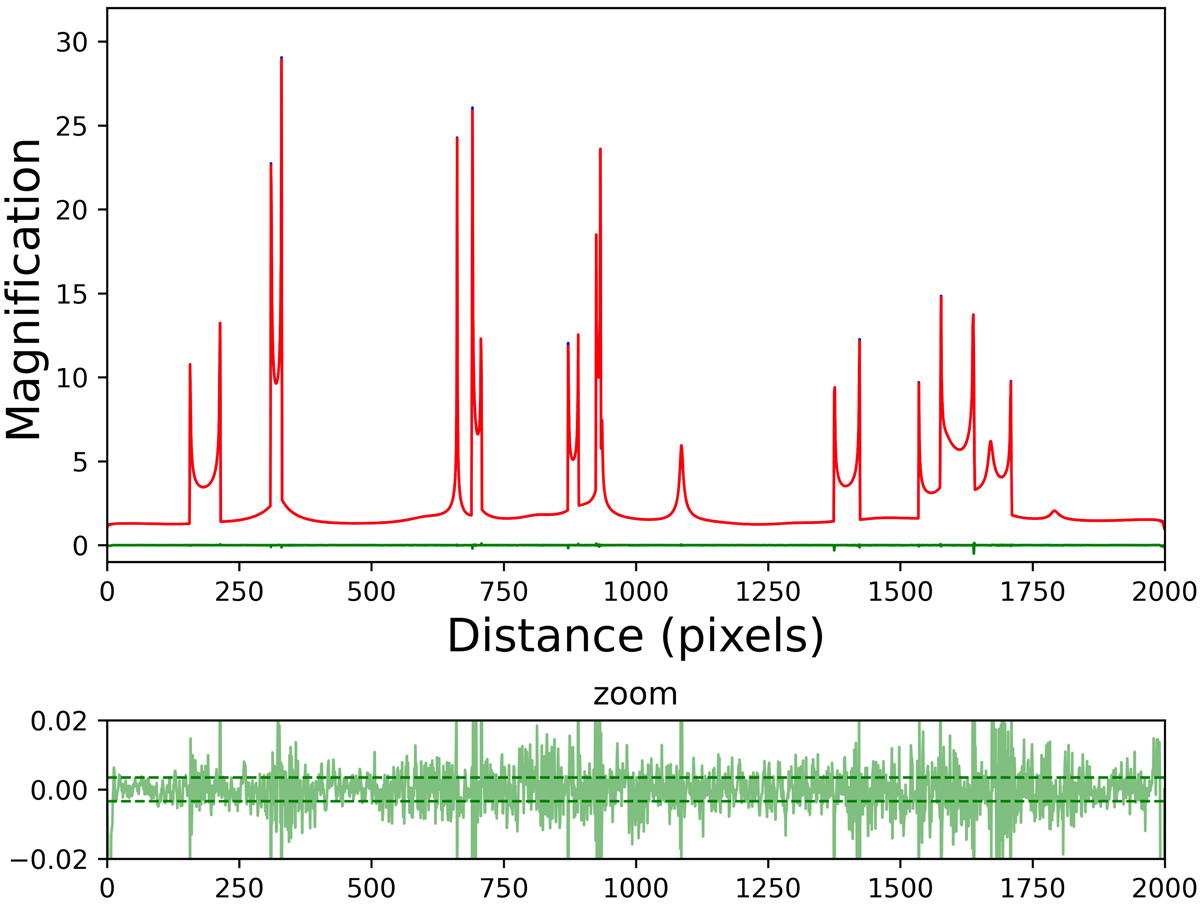
Light curves along the middle row of the maps shown in Fig. 1 (horizontal path at pixel 1000 on the vertical axis). Top panel: light curve for IPM drawn in blue, with the light curve of the combined method superimposed and plotted in red. Both curves are practically indistinguishable, and their differences (in green) are close to zero. Bottom panel: relative differences between the two light curves. The differences are normalised with the IPM map values. The relative difference signal has a noisy behaviour around zero, and the mean value of their absolute values is only 0.0029, i.e., 0.29%.
Current usage metrics show cumulative count of Article Views (full-text article views including HTML views, PDF and ePub downloads, according to the available data) and Abstracts Views on Vision4Press platform.
Data correspond to usage on the plateform after 2015. The current usage metrics is available 48-96 hours after online publication and is updated daily on week days.
Initial download of the metrics may take a while.