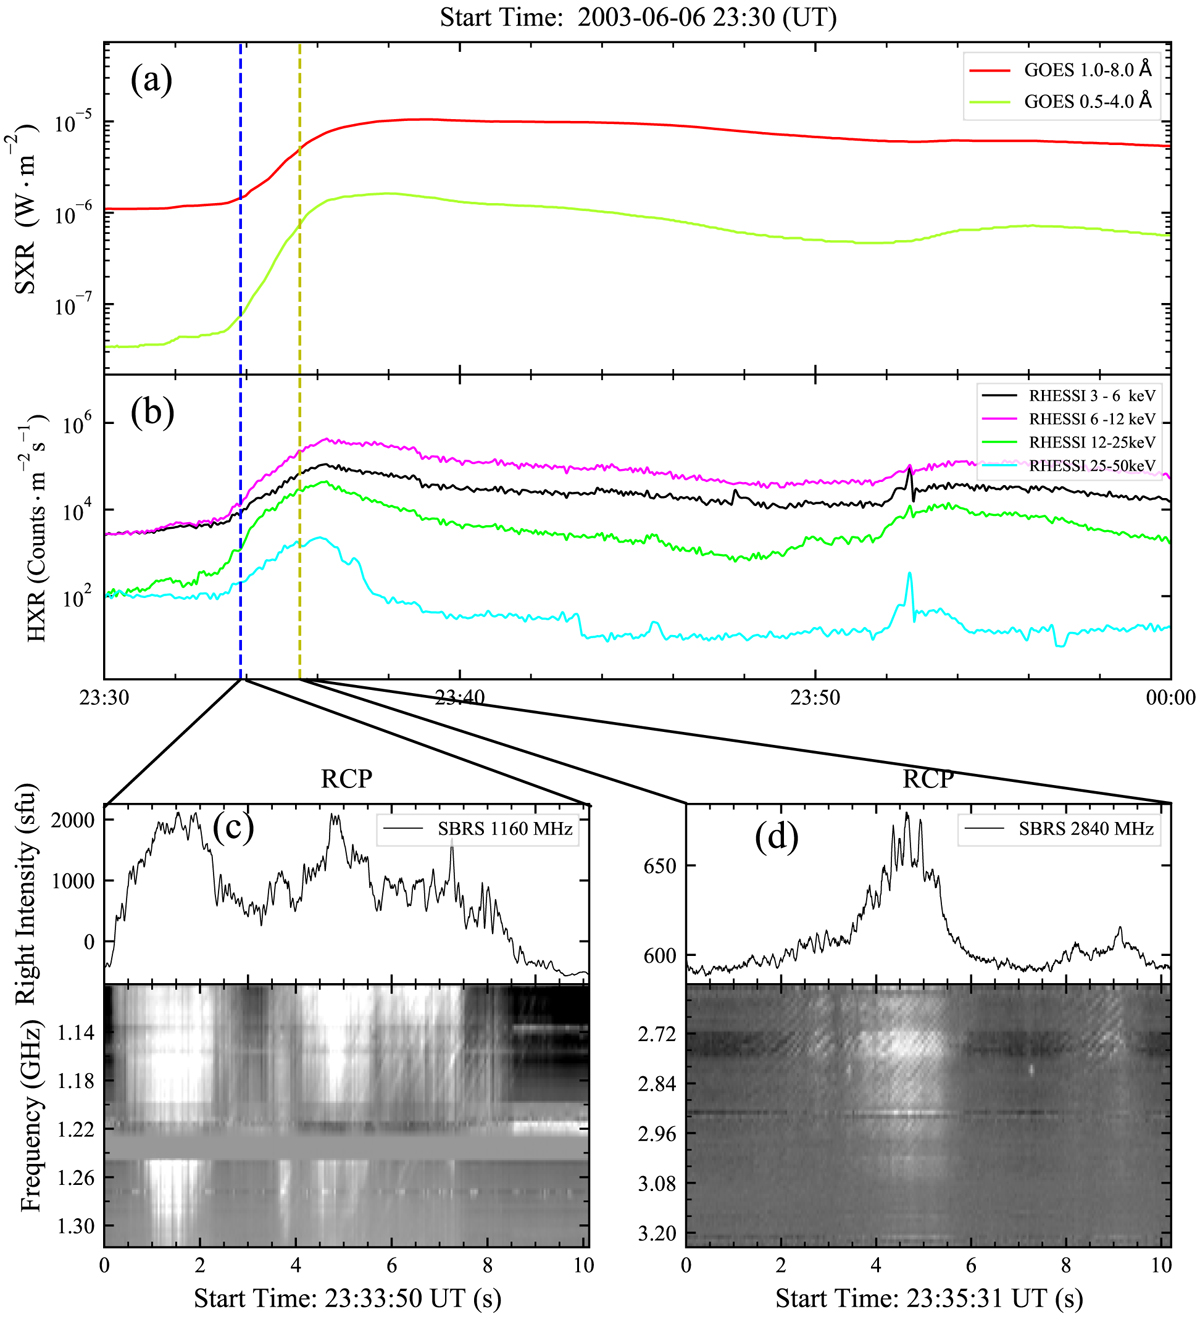
Fig. 4.
Download original image
Fiber events associated with the rising phase of an M1.0 flare on 06 June 2003. (a) The soft X-ray light curve. (b) The hard X-ray light curve. (c) The radio flux at 1160 MHz and the dynamic spectrum of the fiber event in the frequency range of 1.1−1.34 GHz. (d) The radio flux at 2840 MHz and the dynamic spectrum of the fiber event in the frequency range of 2.60−3.80 GHz.
Current usage metrics show cumulative count of Article Views (full-text article views including HTML views, PDF and ePub downloads, according to the available data) and Abstracts Views on Vision4Press platform.
Data correspond to usage on the plateform after 2015. The current usage metrics is available 48-96 hours after online publication and is updated daily on week days.
Initial download of the metrics may take a while.