Free Access
Fig. 2.
Download original image
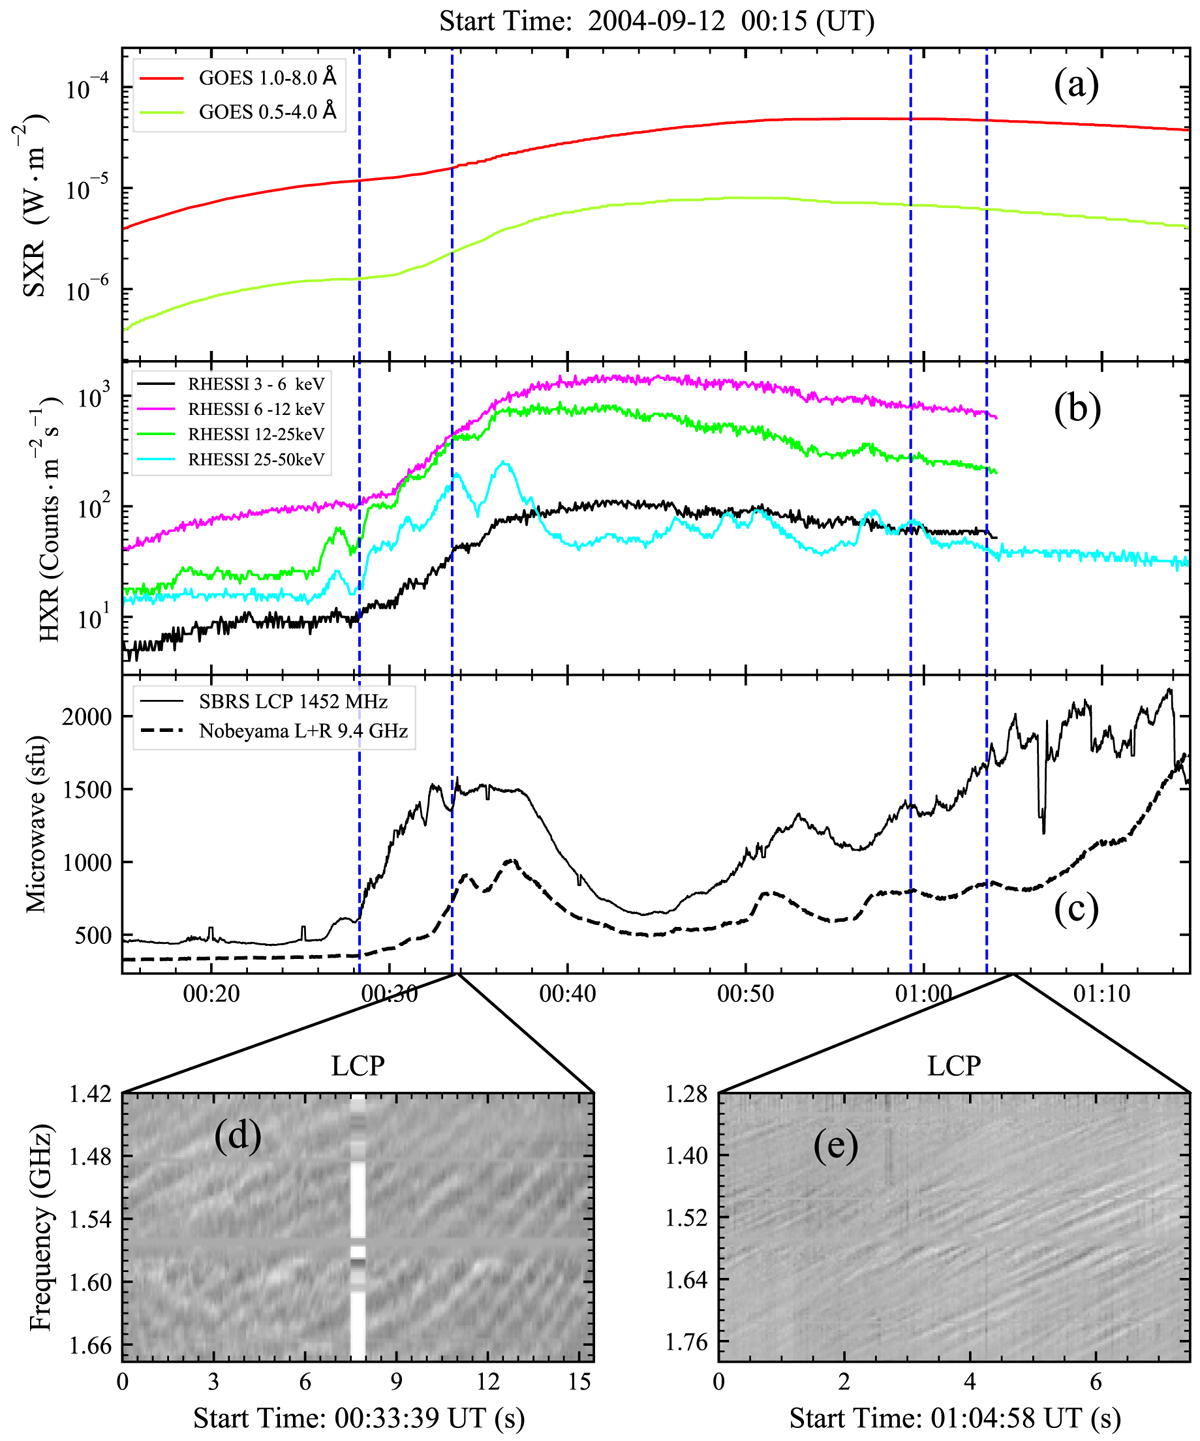
Fiber events in an M4.9 flare on 12 September 2004. (a): The soft X-ray light curve. (b): The hard X-ray light curve. (c): The radio flux at 1425 MHz and 9.7 GHz. (d) and (e): The dynamic spectrum of two fiber events.
Current usage metrics show cumulative count of Article Views (full-text article views including HTML views, PDF and ePub downloads, according to the available data) and Abstracts Views on Vision4Press platform.
Data correspond to usage on the plateform after 2015. The current usage metrics is available 48-96 hours after online publication and is updated daily on week days.
Initial download of the metrics may take a while.