Fig. 3
Download original image
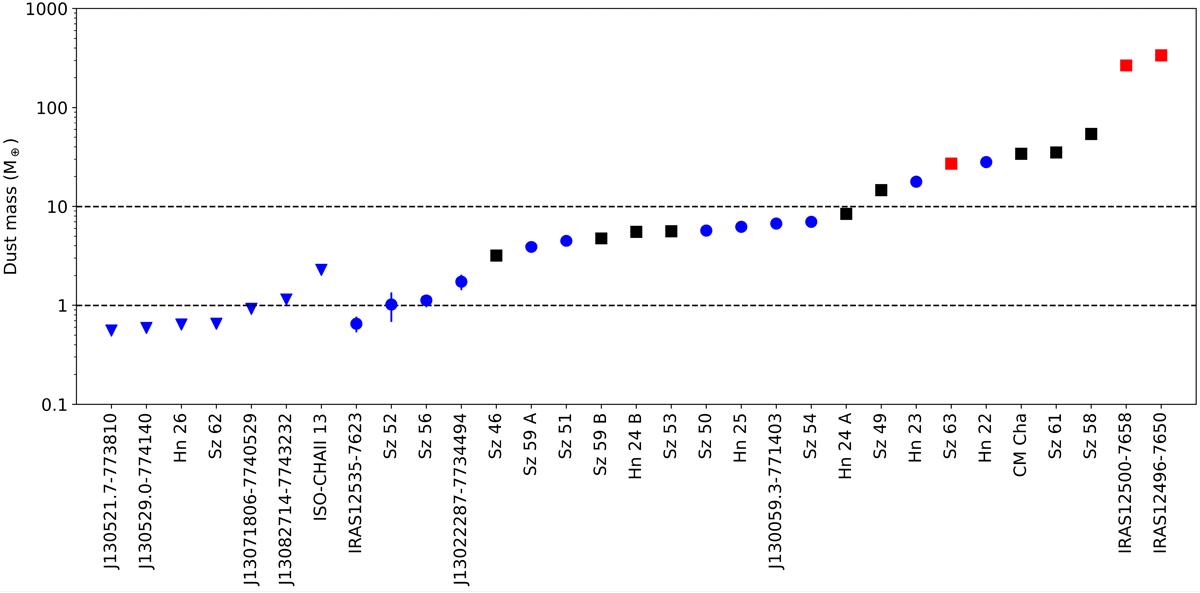
Dust masses for the 31 sources in our Cha II sample expressed in Earth masses, ordered by increasing dust mass(Table 2). The black and red squares indicates the sources also detected in 12CO and 13CO, respectively.Round symbols show continuum only detected sources and the downward-facing triangles correspond to 3σ upper limitsfor non-detections.
Current usage metrics show cumulative count of Article Views (full-text article views including HTML views, PDF and ePub downloads, according to the available data) and Abstracts Views on Vision4Press platform.
Data correspond to usage on the plateform after 2015. The current usage metrics is available 48-96 hours after online publication and is updated daily on week days.
Initial download of the metrics may take a while.