Fig. 1
Download original image
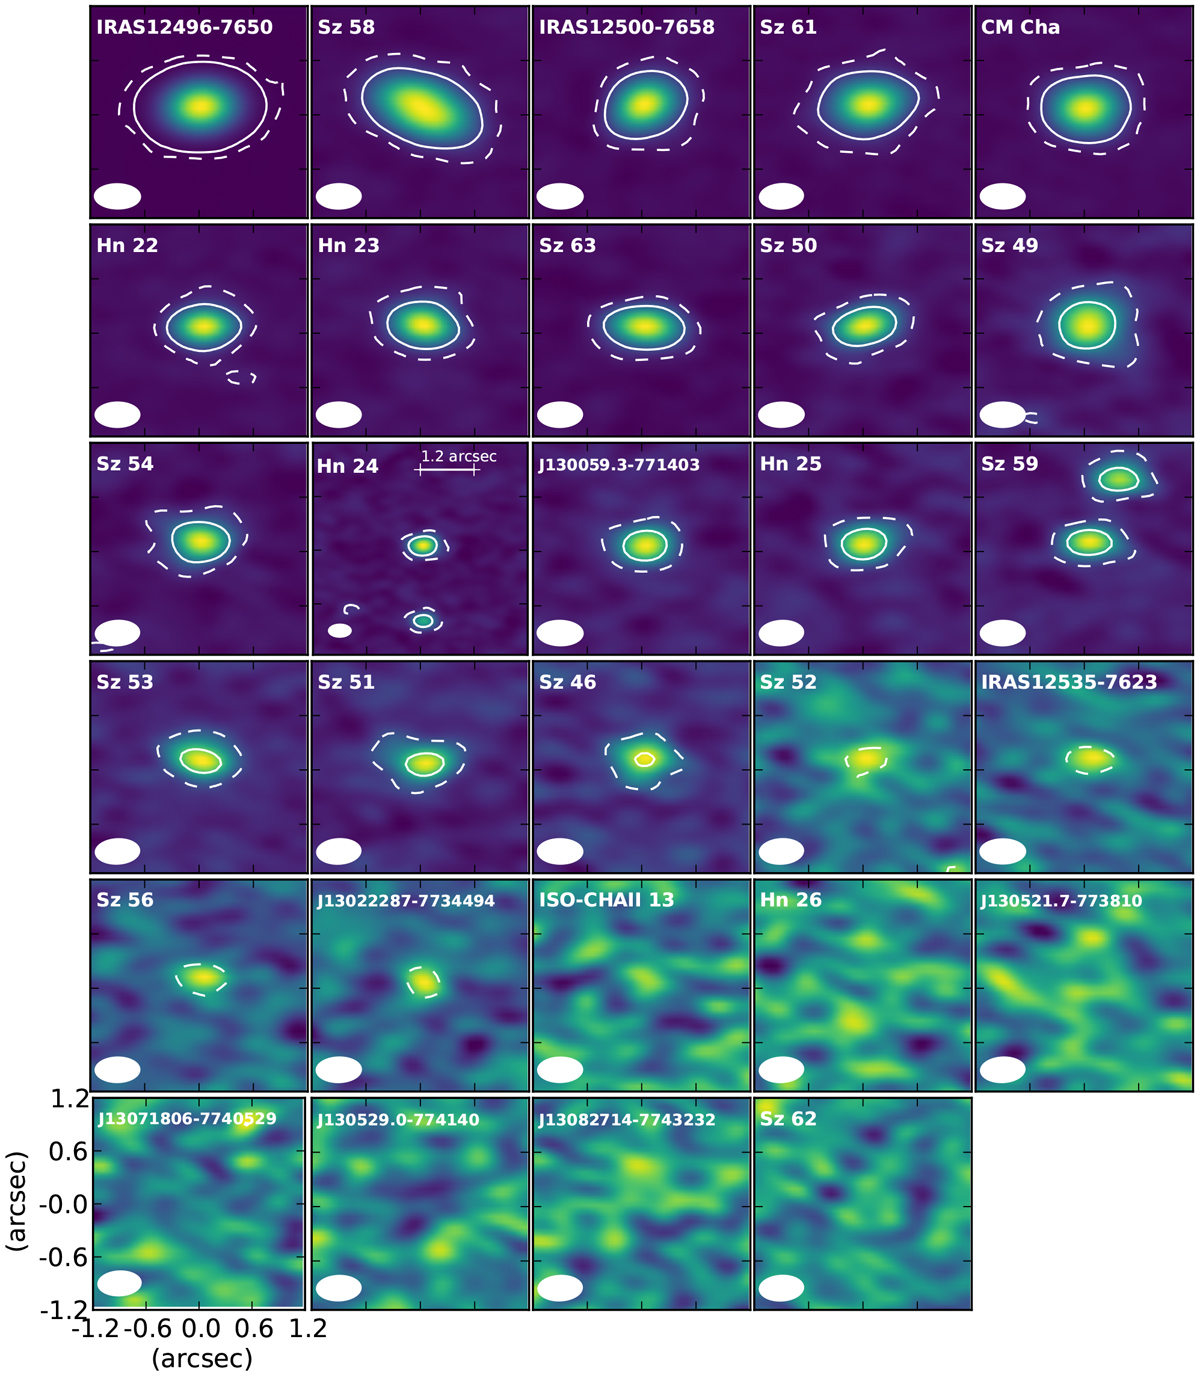
Continuum images ordered by decreasing fluxes. Images are 2.4′′ × 2.4′′, except for Hn 24 where we use 4.8′′ × 4.8′′ to show the secondary source. The beam is shown in the lower left corner of each panel. 3σ and 15σ contours are shown in solid and dashed lines, respectively. The color map is chosen to go from −3 σ to the maximum intensity of each image.
Current usage metrics show cumulative count of Article Views (full-text article views including HTML views, PDF and ePub downloads, according to the available data) and Abstracts Views on Vision4Press platform.
Data correspond to usage on the plateform after 2015. The current usage metrics is available 48-96 hours after online publication and is updated daily on week days.
Initial download of the metrics may take a while.