Free Access
Fig. 5.
Download original image
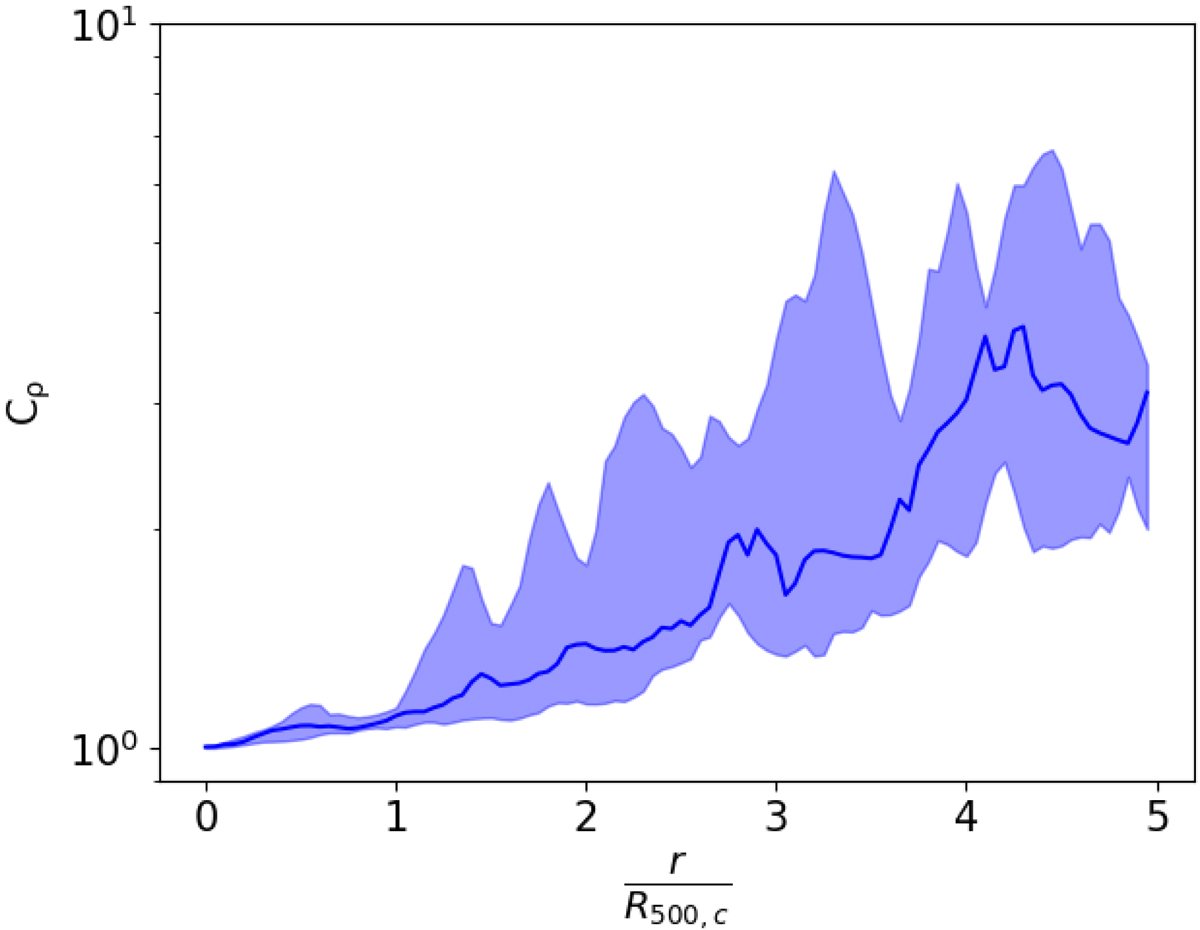
Radial profile of clumping factor for the whole clusters sample. The blue solid line represents the median value, while the shadow region is enclosed between the 16th and the 84th percentile of the distribution at any radii.
Current usage metrics show cumulative count of Article Views (full-text article views including HTML views, PDF and ePub downloads, according to the available data) and Abstracts Views on Vision4Press platform.
Data correspond to usage on the plateform after 2015. The current usage metrics is available 48-96 hours after online publication and is updated daily on week days.
Initial download of the metrics may take a while.