Free Access
Fig. A.1.
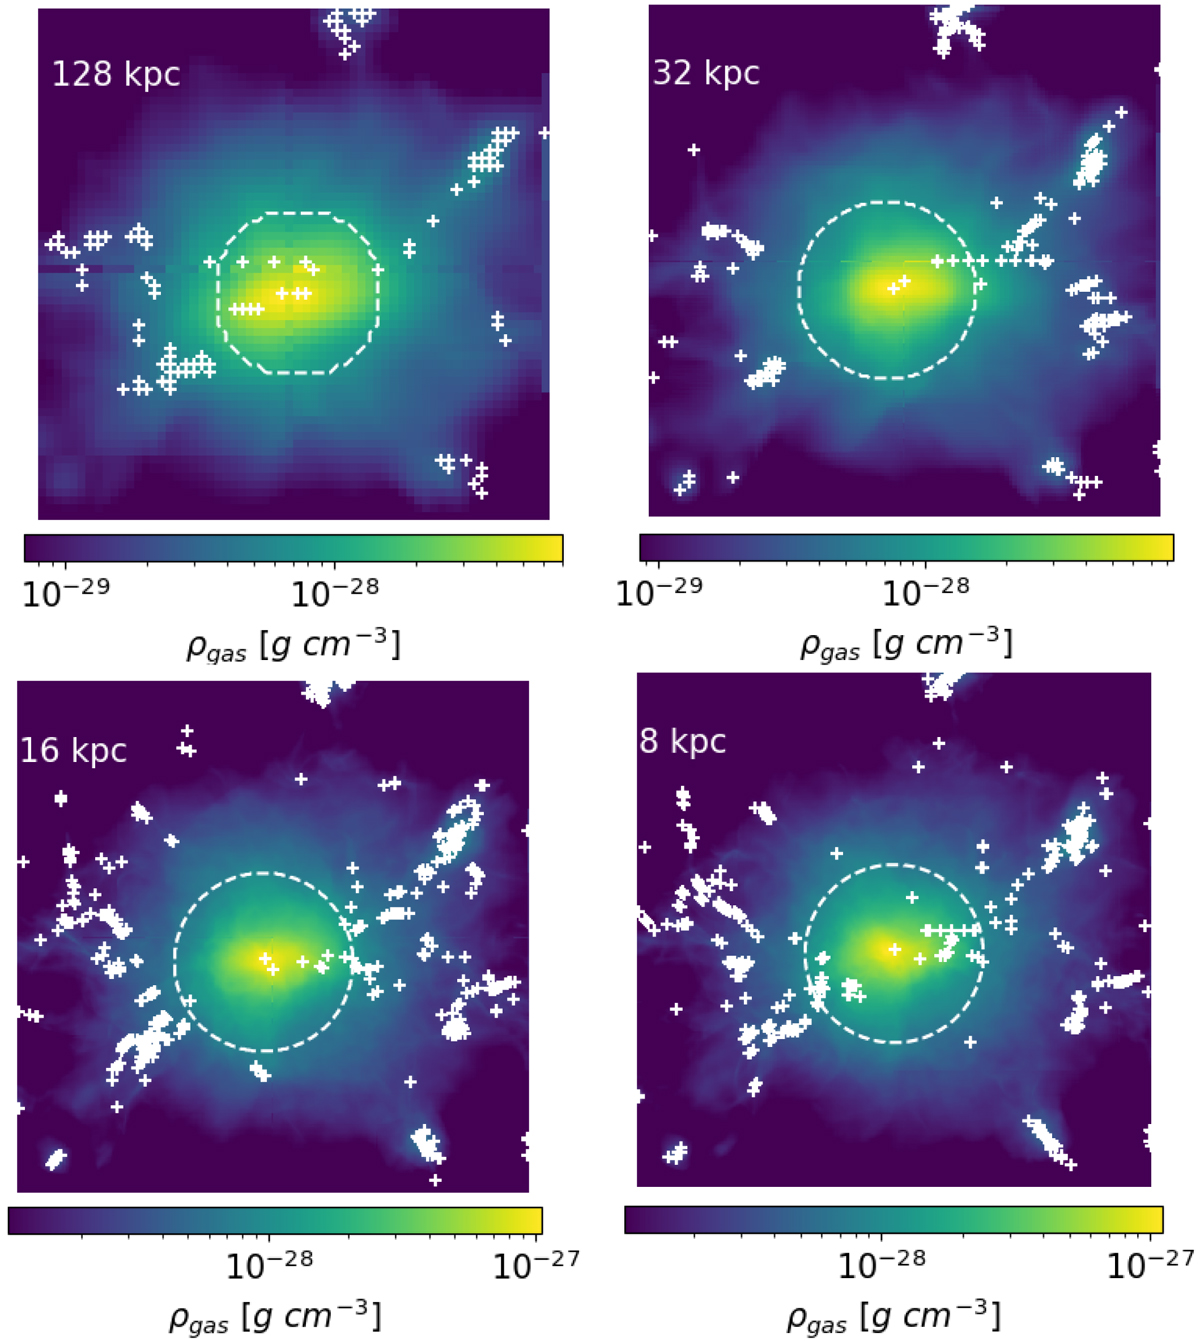
Download original image
Projected gas density for the test cluster, at four different level of numerical resolution (top left: 128 kpc; top right: 32 kpc; bottom left: 16 kpc; bottom right: 8 kpc). The dashed circle represent R500, c, while the white crosses are the center of the identified clumps.
Current usage metrics show cumulative count of Article Views (full-text article views including HTML views, PDF and ePub downloads, according to the available data) and Abstracts Views on Vision4Press platform.
Data correspond to usage on the plateform after 2015. The current usage metrics is available 48-96 hours after online publication and is updated daily on week days.
Initial download of the metrics may take a while.