Fig. 22.
Download original image
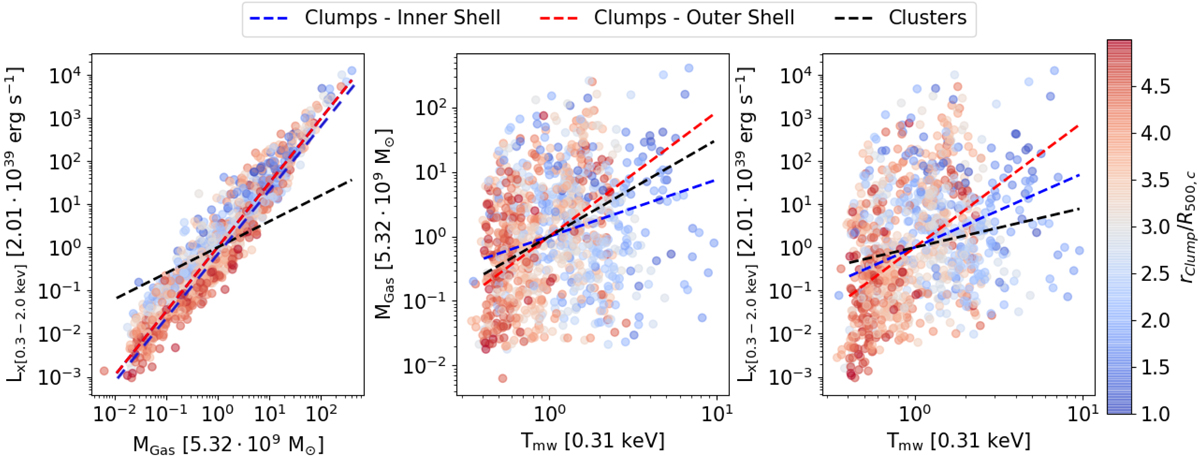
Scaling relations Lx − MGas, MGas − Tmw and Lx − Tmw, from left to right panel, respectively. The dashed lines identify different selections: clumps selected in the inner region in blue (from R500, c to 2.8 ⋅ R500, c), clumps selected in the outer region in red (from 2.8 ⋅ R500, c to 5.0 ⋅ R500, c), cluster sample in black. The colorful dots represent single clump. They are color-coded as a function of the clump’s radial distance from the cluster center, normalized to R500, c. We note that in the left panel the blue dashed line is shifted arbitrarily for visual purpose. Indeed, it is perfectly over-posted on the red one, due to their identical slope.
Current usage metrics show cumulative count of Article Views (full-text article views including HTML views, PDF and ePub downloads, according to the available data) and Abstracts Views on Vision4Press platform.
Data correspond to usage on the plateform after 2015. The current usage metrics is available 48-96 hours after online publication and is updated daily on week days.
Initial download of the metrics may take a while.