Fig. 21.
Download original image
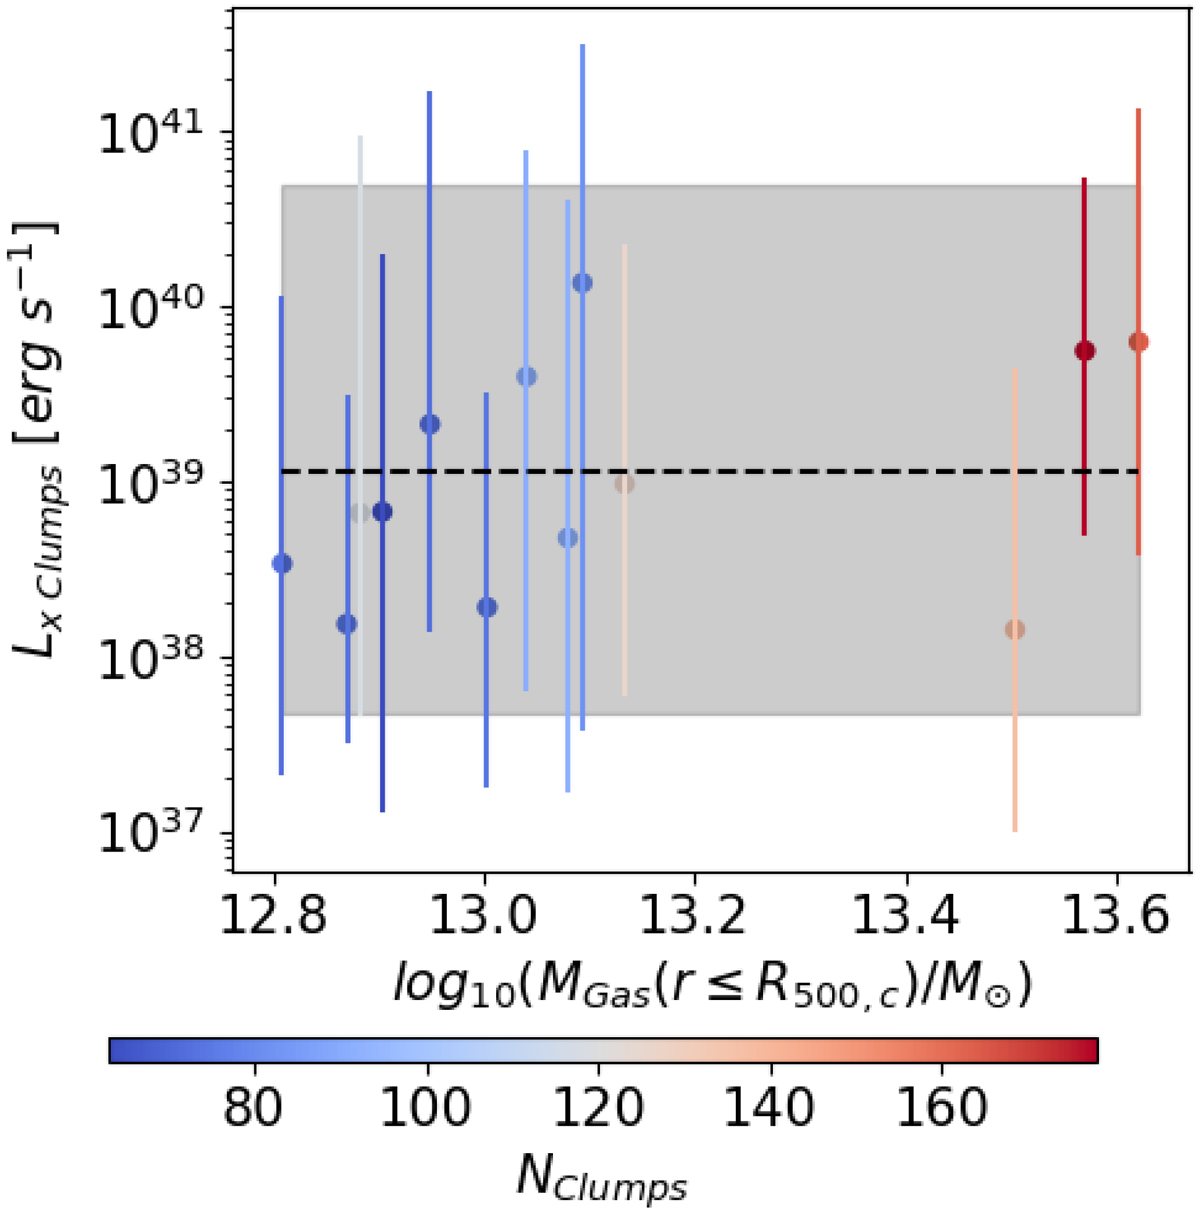
Clump soft X-ray emission ([0.3–2.0] keV band) as a function of the central cluster gas mass. The dots represent the median value, while the error bars are the 16th and 84th distribution percentiles. The color-coding identifies the total number of clumps identified by the clump finder algorithm. The black dashed line represents the median value computed for the entire clump population. The gray shadow region identifies the 16th and 84th percentile boundaries of the clump soft X-ray emission distribution.
Current usage metrics show cumulative count of Article Views (full-text article views including HTML views, PDF and ePub downloads, according to the available data) and Abstracts Views on Vision4Press platform.
Data correspond to usage on the plateform after 2015. The current usage metrics is available 48-96 hours after online publication and is updated daily on week days.
Initial download of the metrics may take a while.