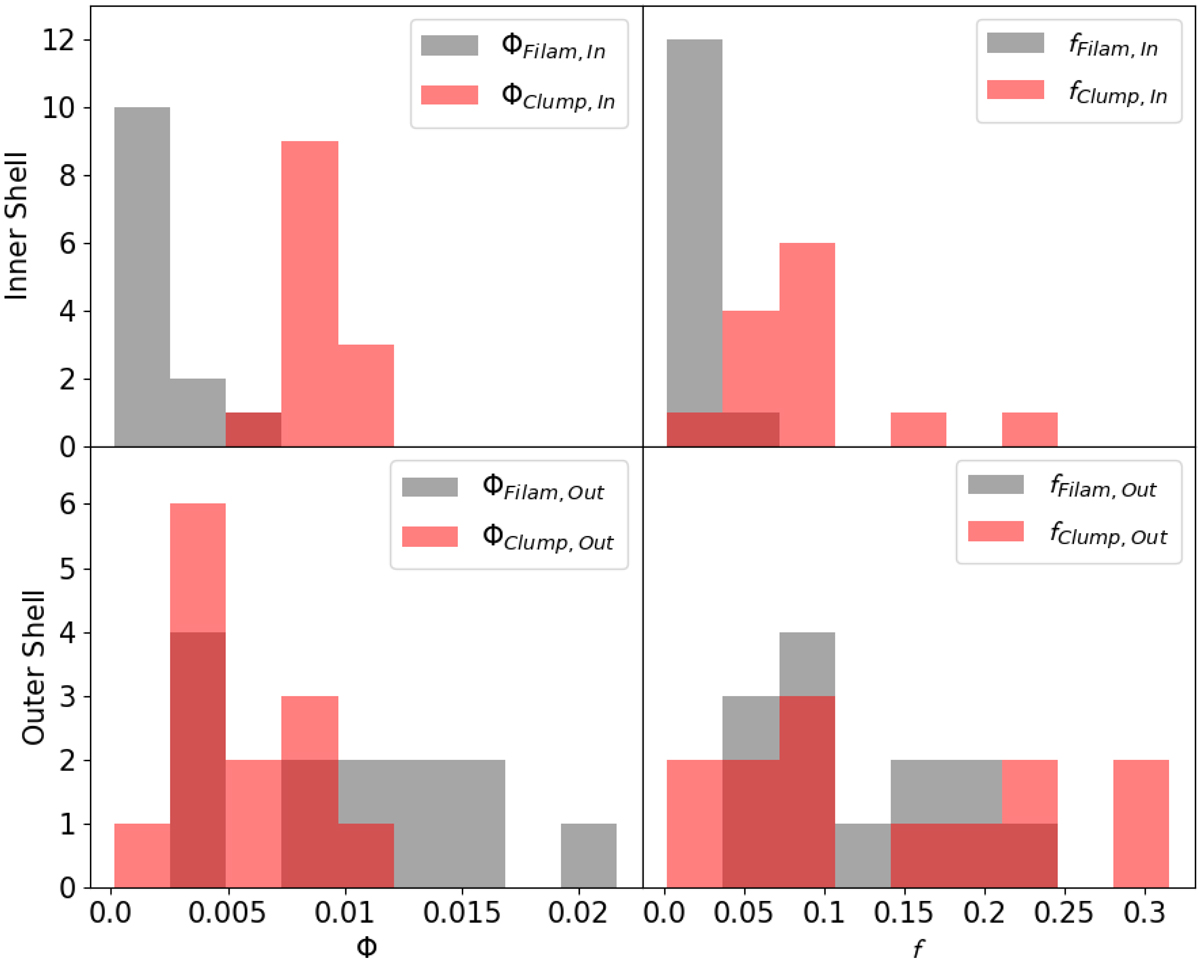
Fig. 20.
Download original image
Comparison between clump and filament volume filling factor distributions, Φ and their mass contributions, f, for the different adopted shells. In all panels, the red histogram represents the clump distribution, while the gray color identifies the filament distribution. The upper panels show Φ (on the left) and f (on the right) for the inner shell, while the bottom panels show the same distributions in the outer shell.
Current usage metrics show cumulative count of Article Views (full-text article views including HTML views, PDF and ePub downloads, according to the available data) and Abstracts Views on Vision4Press platform.
Data correspond to usage on the plateform after 2015. The current usage metrics is available 48-96 hours after online publication and is updated daily on week days.
Initial download of the metrics may take a while.