Fig. 13.
Download original image
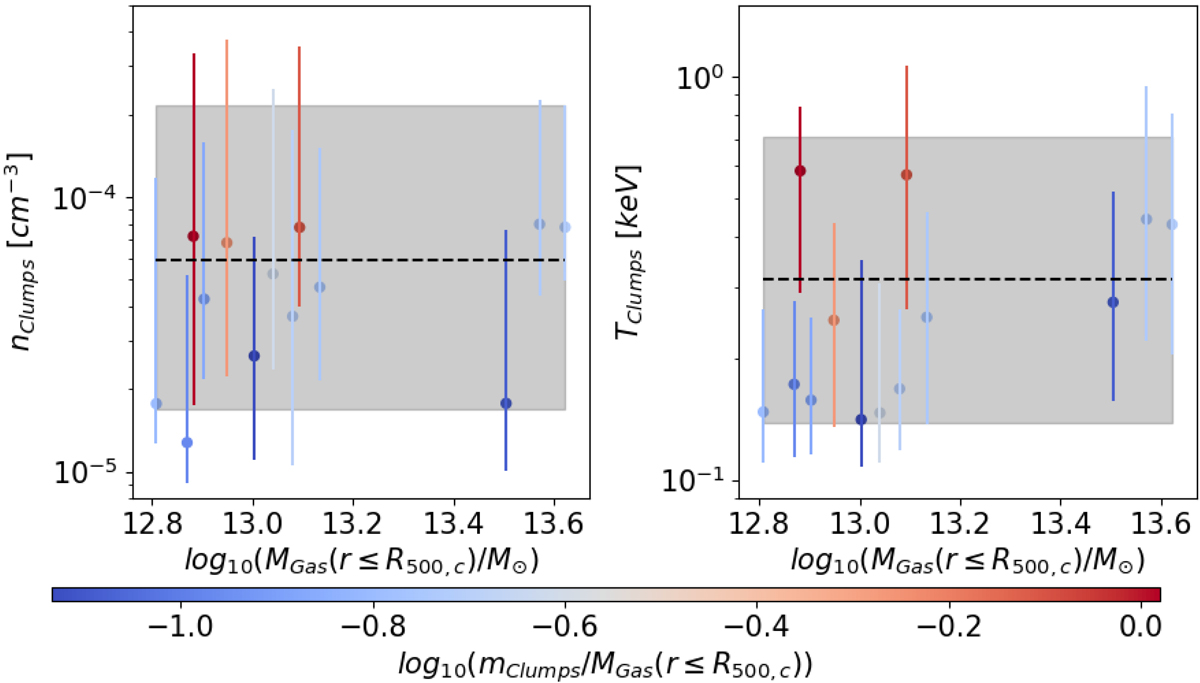
Clump density (on the left, in cm−3) and temperature (on the right, in keV) as a function of M500, c cluster gas mass. In both the panels, the dots represent the median value, while the error bars are the 16th and 84th distribution percentiles. The color-coding is the same for both the panels and it identifies the ratio between the total clump mass and the M500, c cluster mass. The black dashed lines represent the median values of density and temperature for the whole clump population. The shadow gray regions are enclosed in the 16th and 84th of the density and temperature distributions.
Current usage metrics show cumulative count of Article Views (full-text article views including HTML views, PDF and ePub downloads, according to the available data) and Abstracts Views on Vision4Press platform.
Data correspond to usage on the plateform after 2015. The current usage metrics is available 48-96 hours after online publication and is updated daily on week days.
Initial download of the metrics may take a while.