Fig. 12.
Download original image
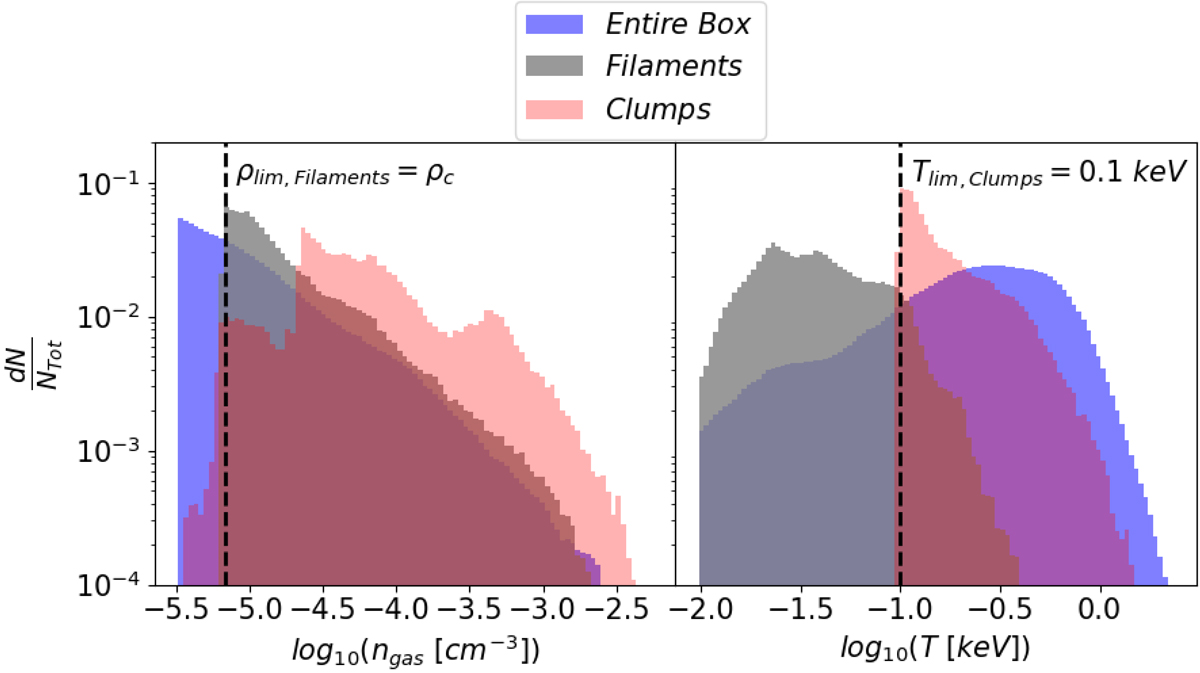
Density and temperature distributions for the different selected regions for the IT90_2 cluster at z = 0.1: the blue areas represent the entire contents of the simulated box, gray areas characterize regions identified as filaments and red areas characterize clumps. Each histogram is normalized to the total number of cells present for the specified selection. The black dashed line in the left panel represents the ρc(z), used as lower limit for the density in the ![]() procedure. On the right panel the black dashed line is the lower temperature limit of 0.1 keV, adopted for the clump finder algorithm as explained in the text.
procedure. On the right panel the black dashed line is the lower temperature limit of 0.1 keV, adopted for the clump finder algorithm as explained in the text.
Current usage metrics show cumulative count of Article Views (full-text article views including HTML views, PDF and ePub downloads, according to the available data) and Abstracts Views on Vision4Press platform.
Data correspond to usage on the plateform after 2015. The current usage metrics is available 48-96 hours after online publication and is updated daily on week days.
Initial download of the metrics may take a while.