Fig. 11.
Download original image
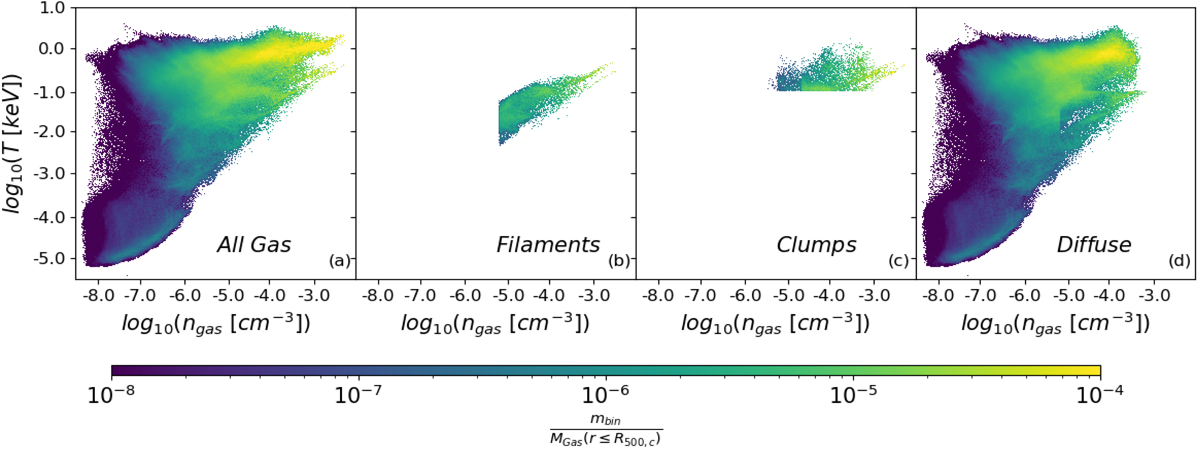
Phase diagrams for the cluster IT90_2 at z = 0.1. (a): all gas present in the simulated box enclosing IT90_2; (b): filaments selected by the ![]() proxy; (c): clumps identified as described in Sect. 2.2; (d): Diffuse gas located on radii over R500, c and not organized into clumps or filaments. The color-coding identifies the mass enclosed in each single bin, normalized by the central cluster’s gas mass.
proxy; (c): clumps identified as described in Sect. 2.2; (d): Diffuse gas located on radii over R500, c and not organized into clumps or filaments. The color-coding identifies the mass enclosed in each single bin, normalized by the central cluster’s gas mass.
Current usage metrics show cumulative count of Article Views (full-text article views including HTML views, PDF and ePub downloads, according to the available data) and Abstracts Views on Vision4Press platform.
Data correspond to usage on the plateform after 2015. The current usage metrics is available 48-96 hours after online publication and is updated daily on week days.
Initial download of the metrics may take a while.