Fig. 10.
Download original image
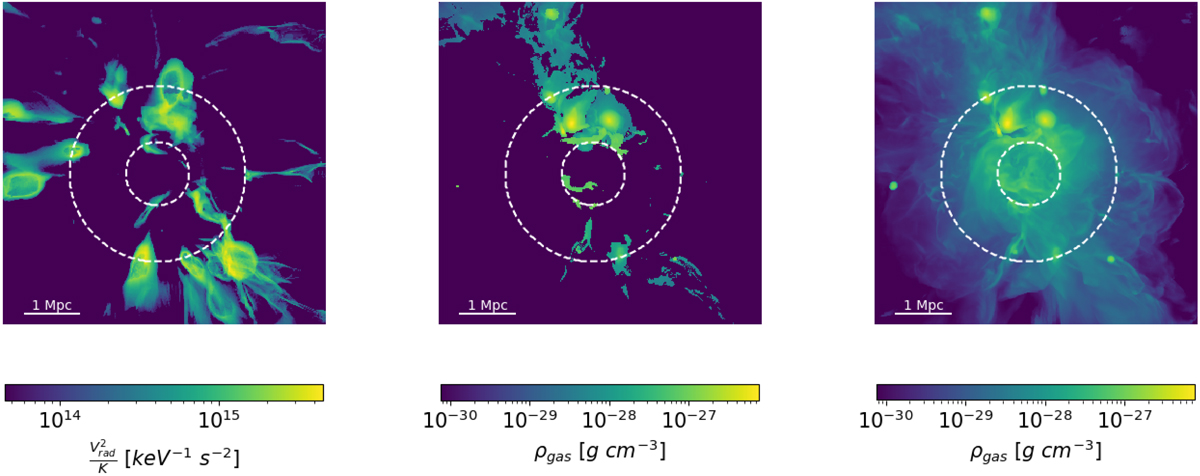
Visual comparison between filaments, clumps, and WHIM. Left panel: projected integrated ![]() for the filaments; center panel: projected emission weighted density for the clumps; right panel: projected emission weighted density for the gas with temperature between 105 K and 107 K. The cluster used is IT90_2 at z = 0.1. The dashed circles represent R500, c and 2.8 ⋅ R500, c.
for the filaments; center panel: projected emission weighted density for the clumps; right panel: projected emission weighted density for the gas with temperature between 105 K and 107 K. The cluster used is IT90_2 at z = 0.1. The dashed circles represent R500, c and 2.8 ⋅ R500, c.
Current usage metrics show cumulative count of Article Views (full-text article views including HTML views, PDF and ePub downloads, according to the available data) and Abstracts Views on Vision4Press platform.
Data correspond to usage on the plateform after 2015. The current usage metrics is available 48-96 hours after online publication and is updated daily on week days.
Initial download of the metrics may take a while.