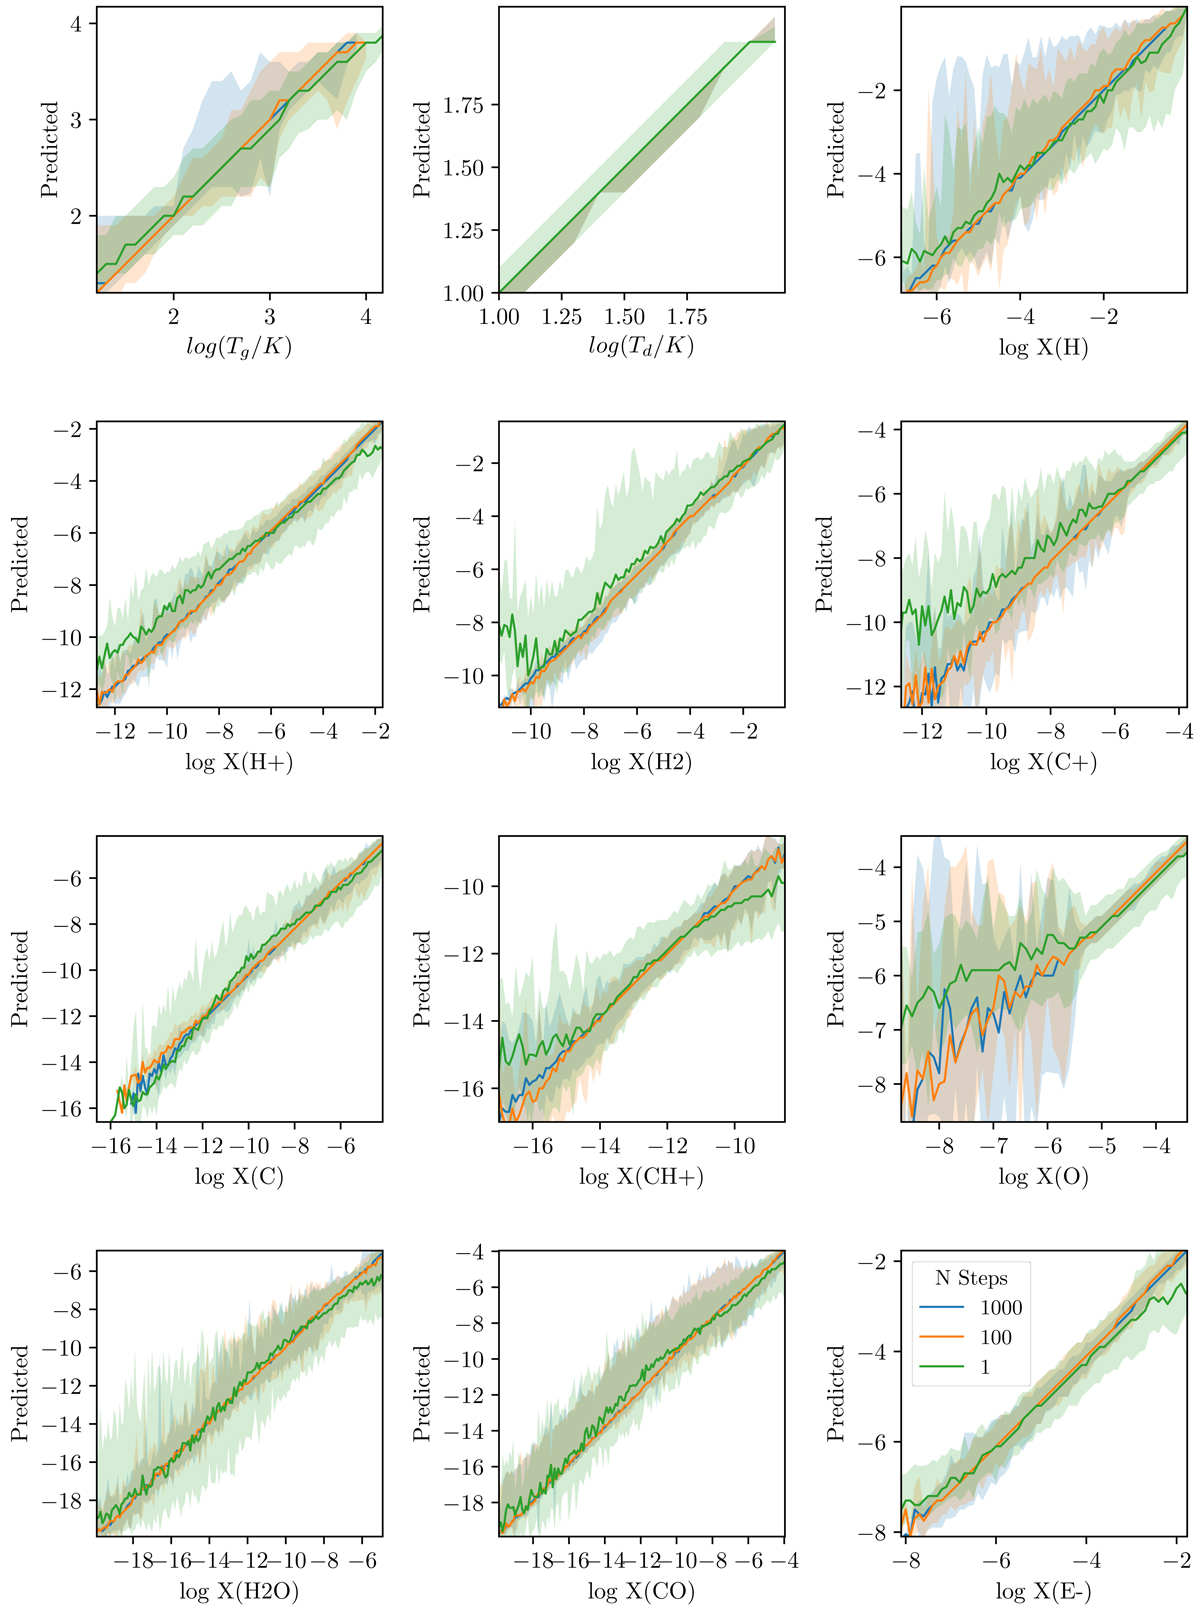
Fig. 7.
Download original image
Predicted against real values for time steps in the test set. The median is plotted as a line, and the shaded region shows the range predicted by 95% of the models. The colours represent the number of time steps emulated. For example, the blue lines show the predicted evolution of the chemistry for 1 Myr compared to the actual value after 1 Myr. We note that the dust temperature error is stable as it is a function of UV and column density, which do not change.
Current usage metrics show cumulative count of Article Views (full-text article views including HTML views, PDF and ePub downloads, according to the available data) and Abstracts Views on Vision4Press platform.
Data correspond to usage on the plateform after 2015. The current usage metrics is available 48-96 hours after online publication and is updated daily on week days.
Initial download of the metrics may take a while.