Fig. 2.
Download original image
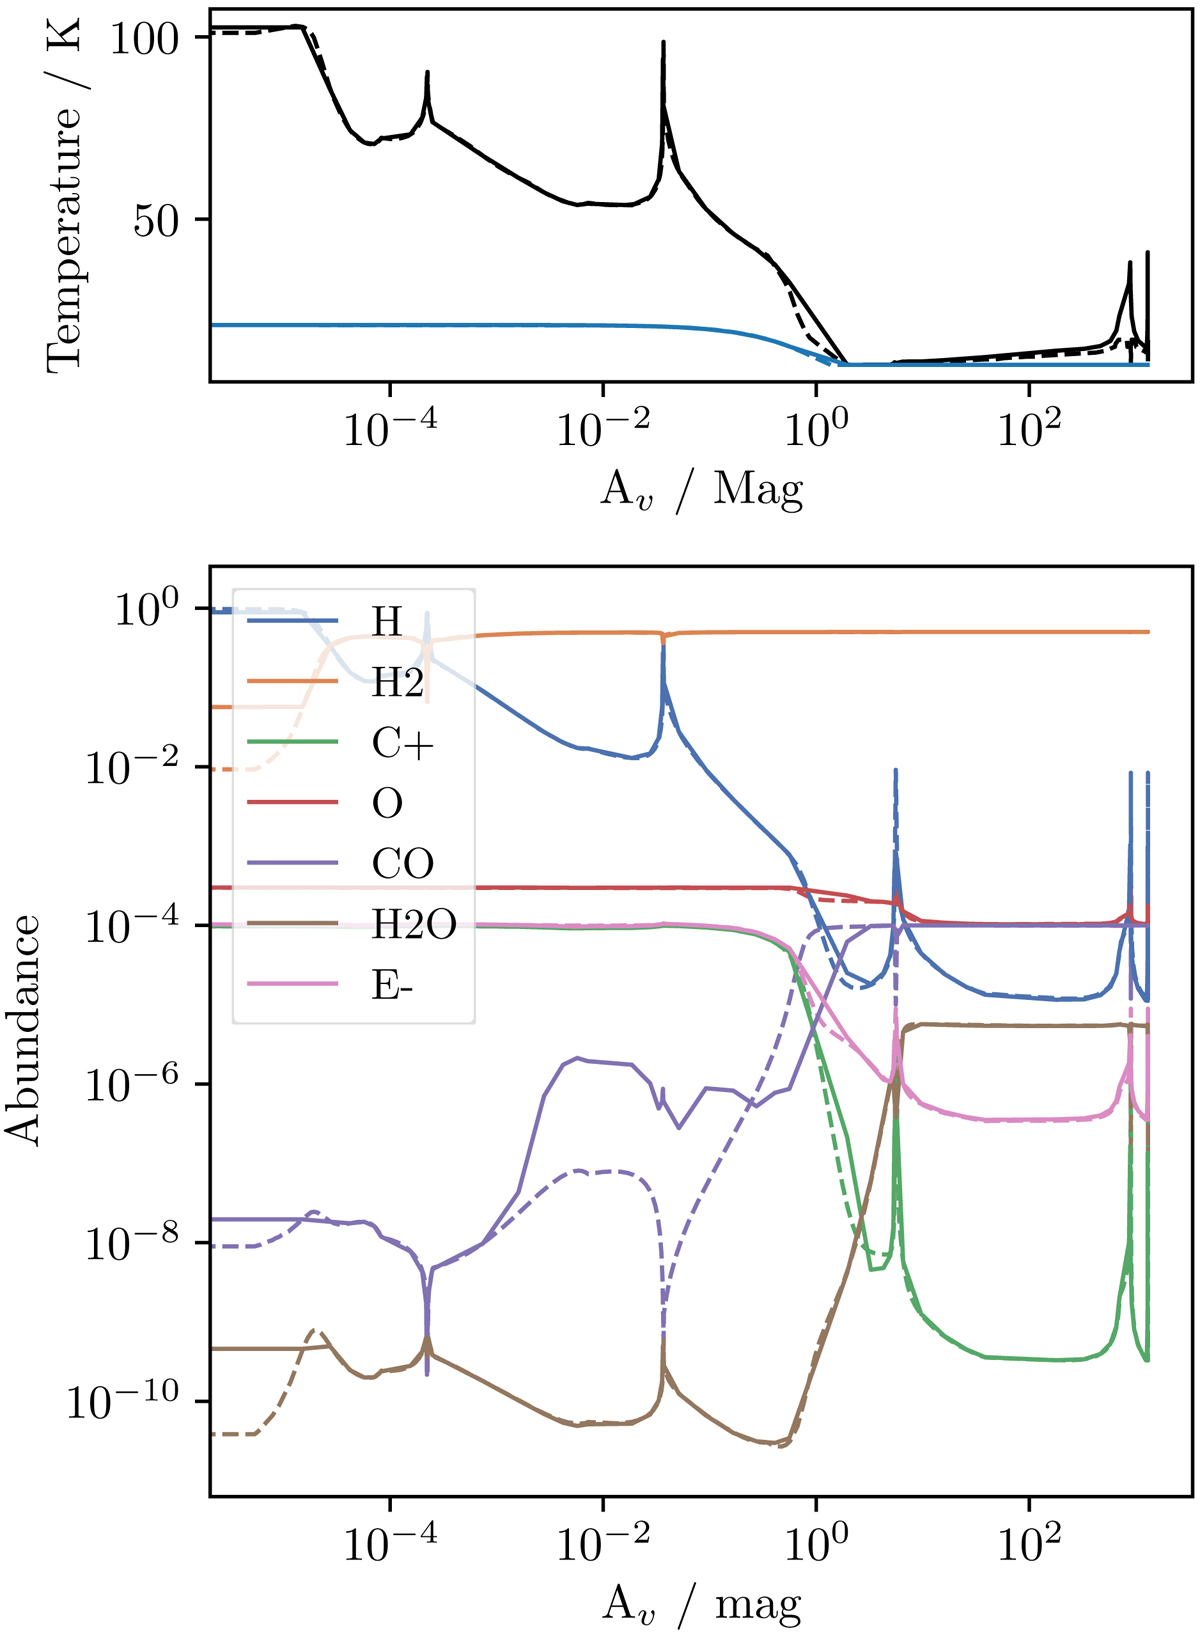
Comparison between the UCLCHEM and UCL_PDR results for a cloud of sinusoidally varying density. Upper: gas (black) and dust (blue) temperature against Av. Lower: fractional abundance against Av. In both plots, results from UCLCHEM are plotted as solid lines and equivalent values from UCL_PDR are plotted with dashed lines in the same colour.
Current usage metrics show cumulative count of Article Views (full-text article views including HTML views, PDF and ePub downloads, according to the available data) and Abstracts Views on Vision4Press platform.
Data correspond to usage on the plateform after 2015. The current usage metrics is available 48-96 hours after online publication and is updated daily on week days.
Initial download of the metrics may take a while.