Free Access
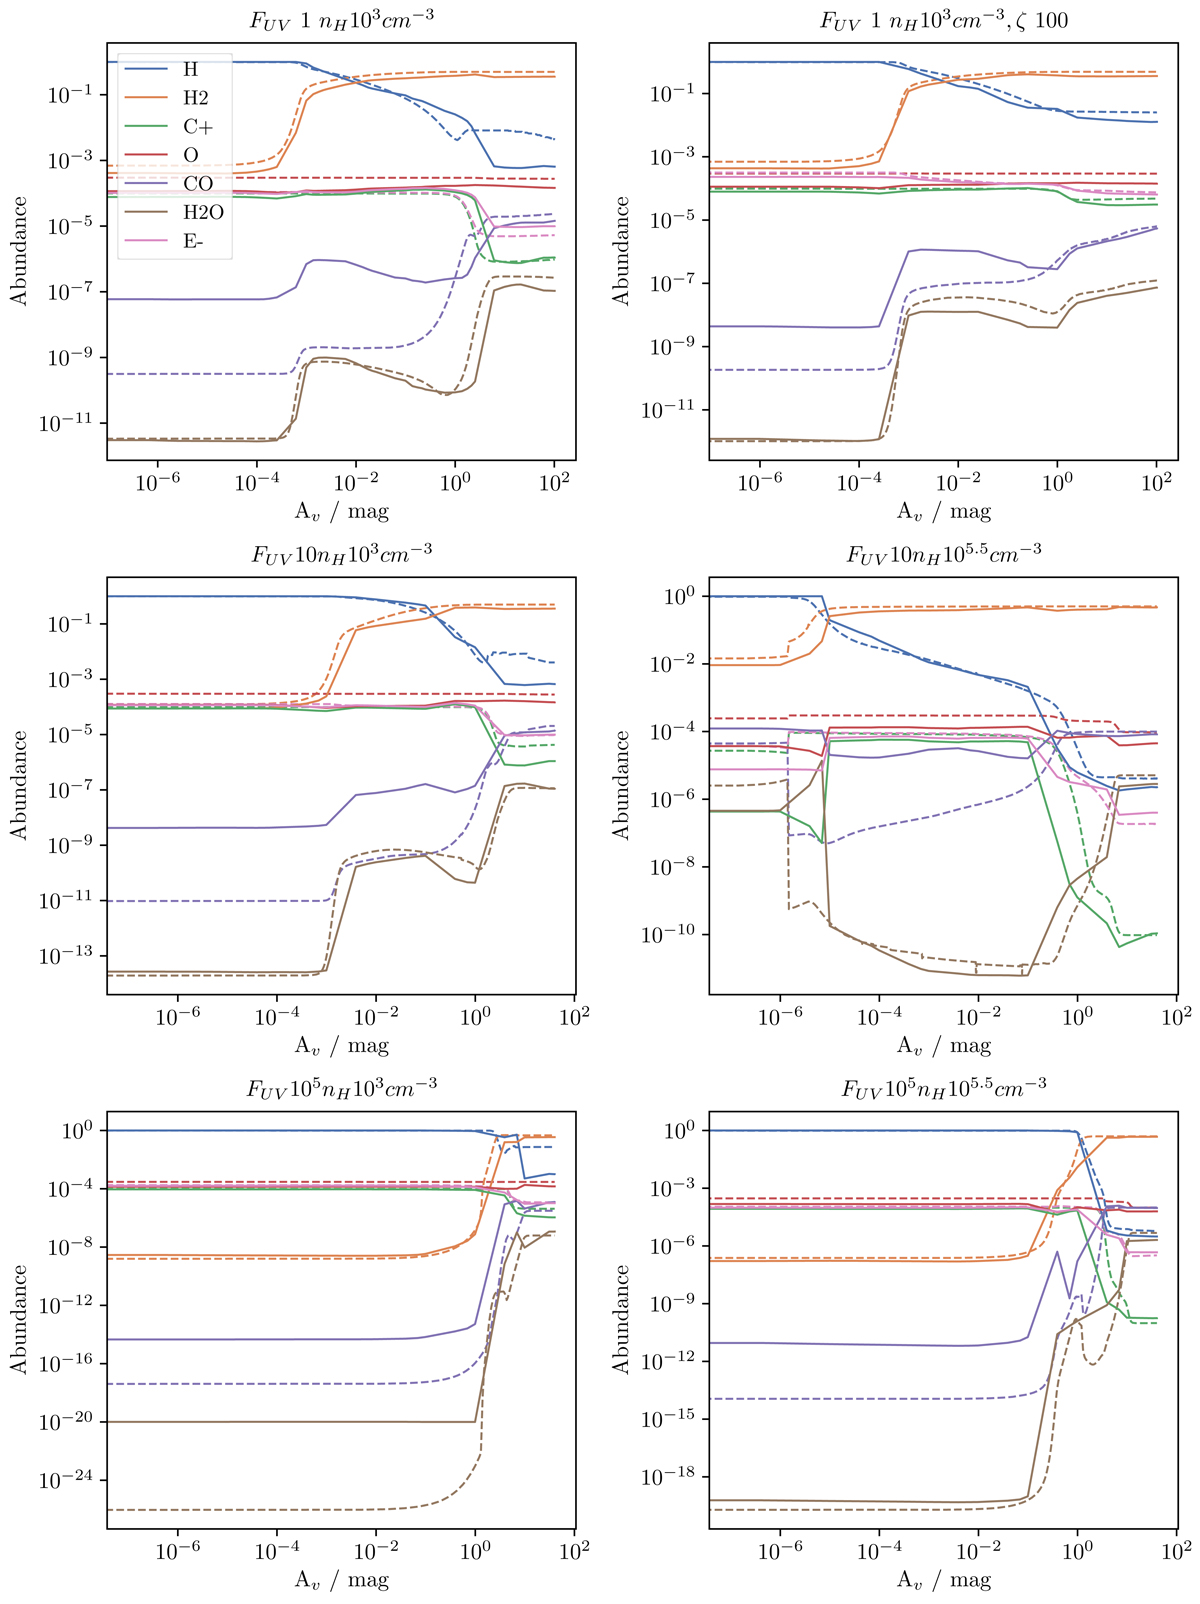
Fig. 12.
Download original image
Comparison of the equilibrium abundances obtained with UCL_PDR and Chemulator for each of the benchmark models. UCL_PDR abundances are shown as dashed lines, and the Chemulator abundances are shown as solid lines.
Current usage metrics show cumulative count of Article Views (full-text article views including HTML views, PDF and ePub downloads, according to the available data) and Abstracts Views on Vision4Press platform.
Data correspond to usage on the plateform after 2015. The current usage metrics is available 48-96 hours after online publication and is updated daily on week days.
Initial download of the metrics may take a while.