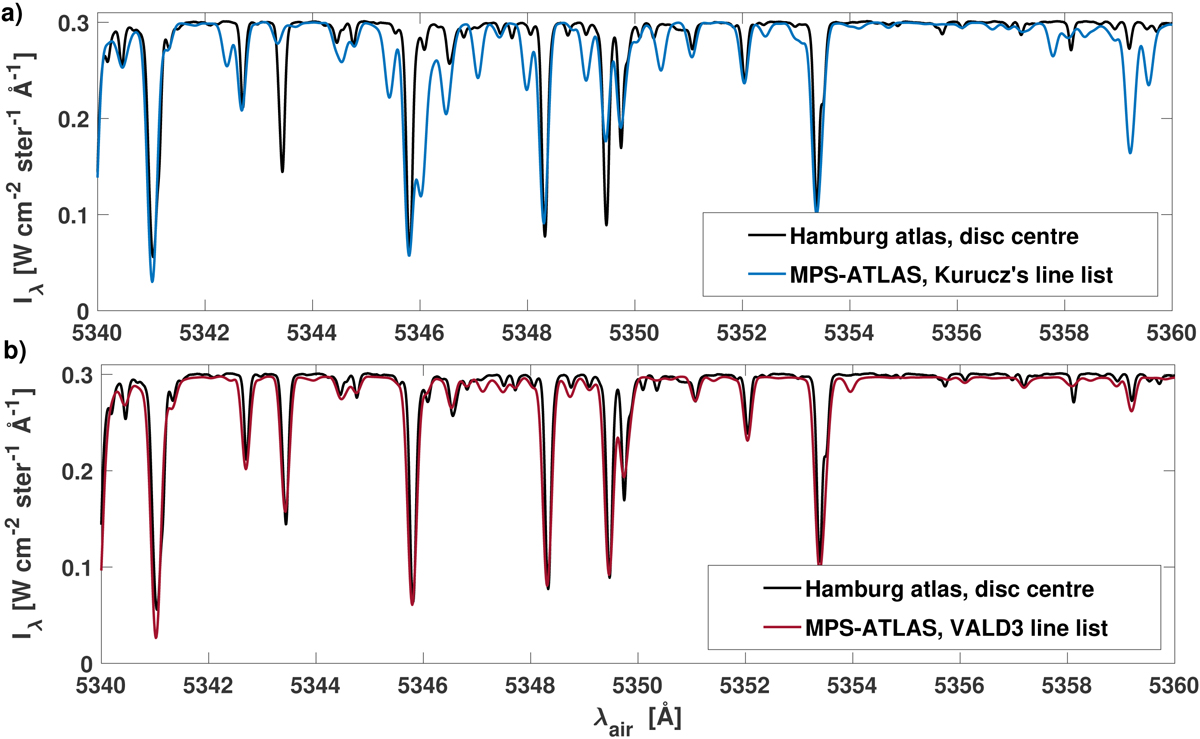
Fig. 8.
Download original image
High-resolution solar disc-centre intensity in the range 5340 Å–5360 Å computed with MPS-ATLAS using different line lists together with data from the Hamburg atlas of the solar spectrum (Neckel 1999; Doerr et al. 2016): (a) computed intensity using Kurucz’s line list and the Hamburg atlas data, (b) intensity using the VALD3 line list and the Hamburg atlas data.
Current usage metrics show cumulative count of Article Views (full-text article views including HTML views, PDF and ePub downloads, according to the available data) and Abstracts Views on Vision4Press platform.
Data correspond to usage on the plateform after 2015. The current usage metrics is available 48-96 hours after online publication and is updated daily on week days.
Initial download of the metrics may take a while.