Fig. 8
Download original image
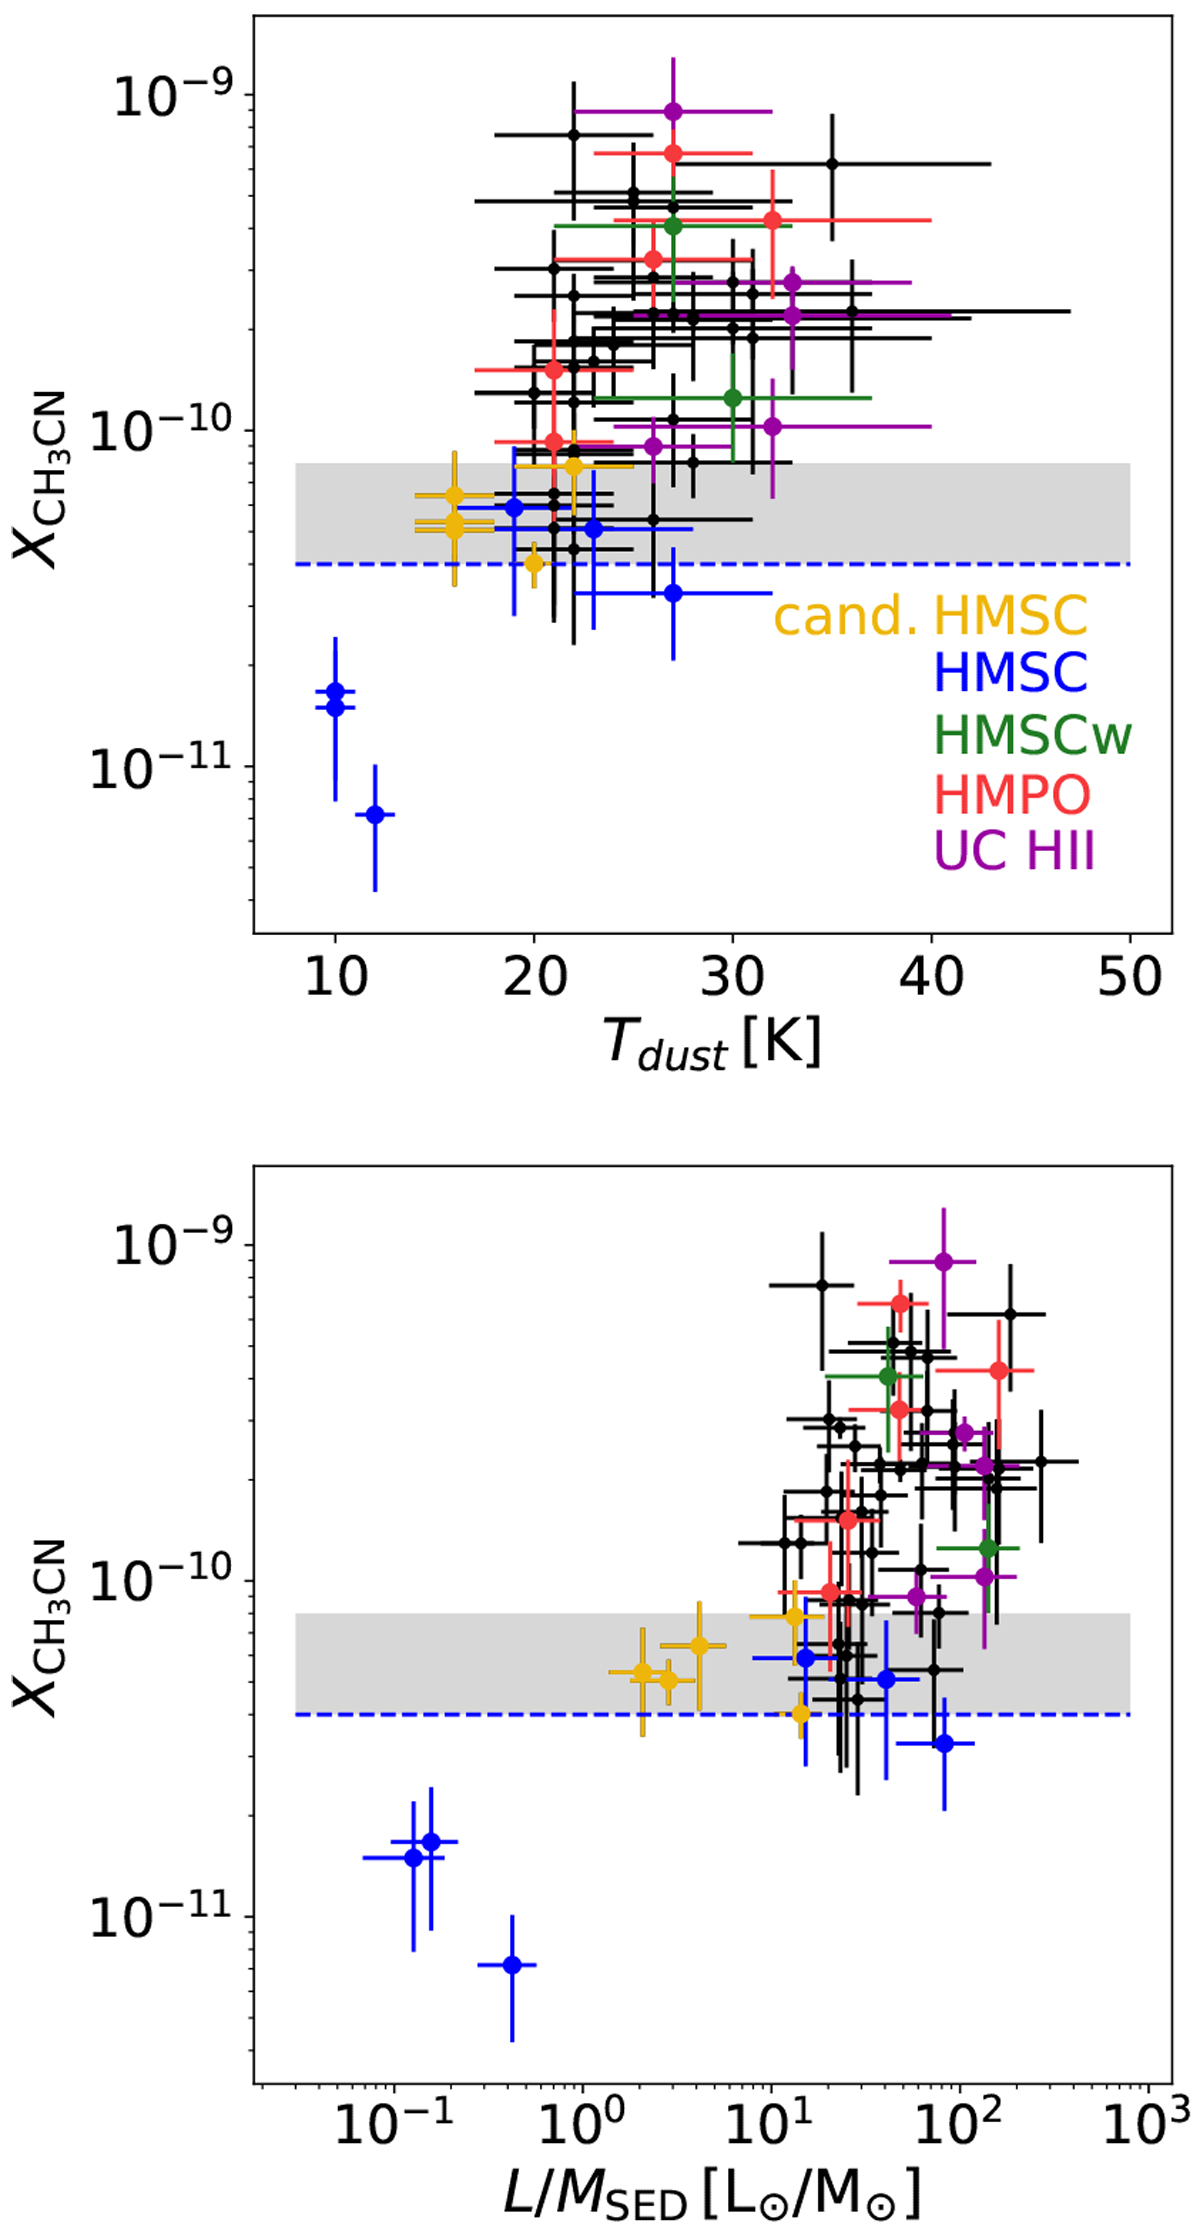
Distribution of the abundances of CH3CN as a function of the two indicators of evolution Tdust (top panel) and L∕M (bottom panel). The yellow points represent the five sources of Subsample II identified as early evolutionary stage, candidates HMSCs or very early HMPOs. The blue dashed line indicates the conservative threshold for abundances of methyl cyanide of 4 × 10⁻¹¹ (only HMSCs), while the gray area indicates the abundance range in which the sources are most likely HMSCs or very early HMPOs.
Current usage metrics show cumulative count of Article Views (full-text article views including HTML views, PDF and ePub downloads, according to the available data) and Abstracts Views on Vision4Press platform.
Data correspond to usage on the plateform after 2015. The current usage metrics is available 48-96 hours after online publication and is updated daily on week days.
Initial download of the metrics may take a while.