Fig. 2
Download original image
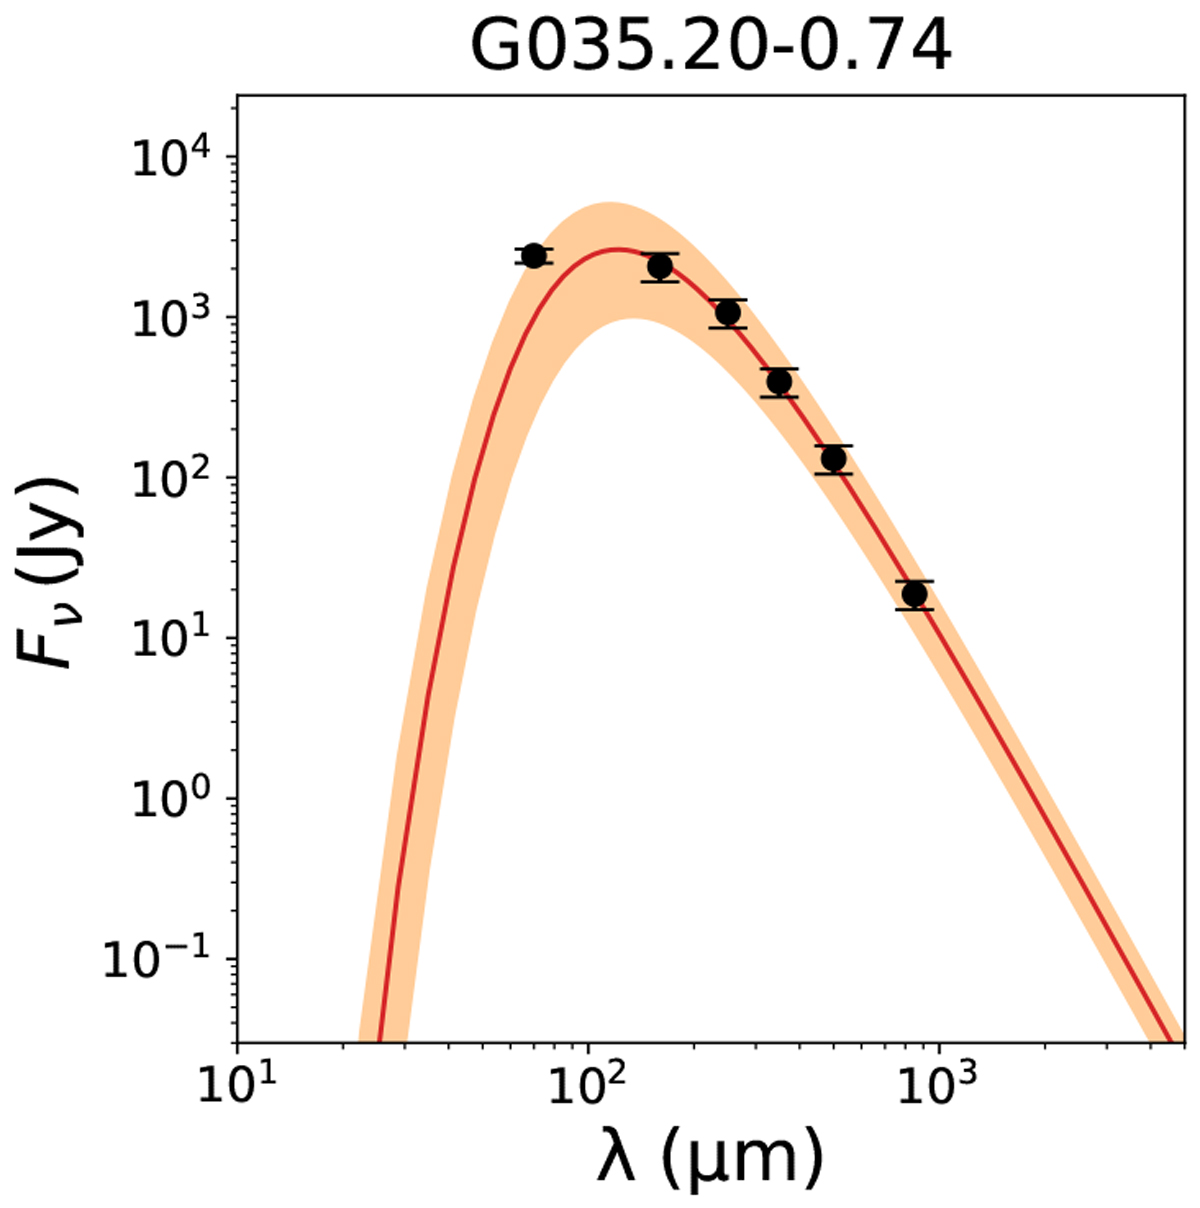
SED of the source G035.20-0.74. The red line is the best fit to the SED, obtained using the parameters
![]() and Tdust
given in Table 4. The orange area represents the variation from the best fit if the two parameters are varied inside the uncertainties. The point at 70 μm has not been used to constrain the fit of the SED, but it has been used to derive the luminosity of the sources.
and Tdust
given in Table 4. The orange area represents the variation from the best fit if the two parameters are varied inside the uncertainties. The point at 70 μm has not been used to constrain the fit of the SED, but it has been used to derive the luminosity of the sources.
Current usage metrics show cumulative count of Article Views (full-text article views including HTML views, PDF and ePub downloads, according to the available data) and Abstracts Views on Vision4Press platform.
Data correspond to usage on the plateform after 2015. The current usage metrics is available 48-96 hours after online publication and is updated daily on week days.
Initial download of the metrics may take a while.