Fig. B.1.
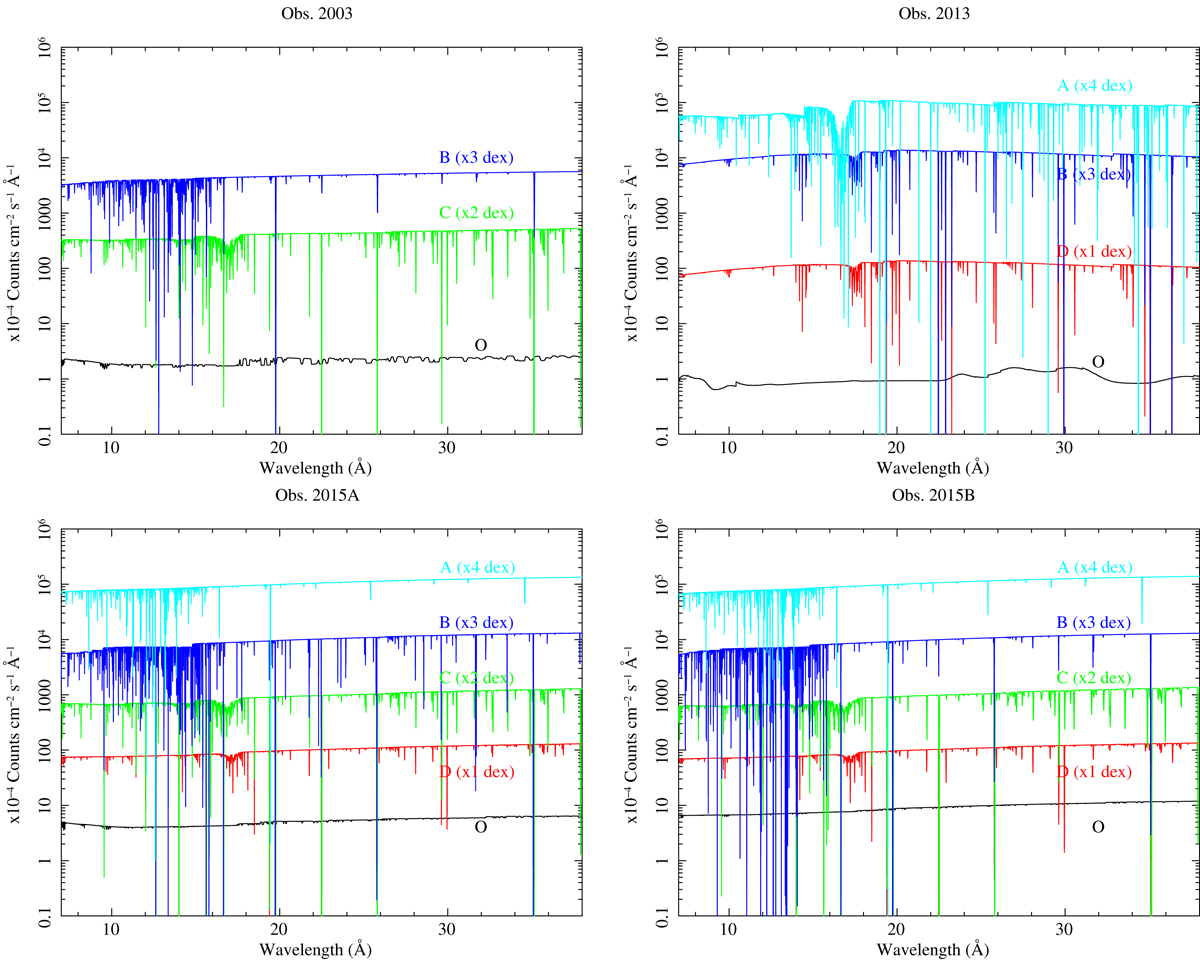
Download original image
Model plot showing the contribution to the RGS spectrum of each of the xabs components that model the absorption troughs seen in NGC 985 for the observations in 2003 (upper left panel), 2013 (upper right panel), 2015a (lower left panel), and 2015b (lower right panel). For clarity, the contribution of Component D has been shifted by 1 dex in flux, the one of Component C by 2 dex, the one of Component B by 3 dex, and the one of Component A by 4 dex, whenever they have been detected.
Current usage metrics show cumulative count of Article Views (full-text article views including HTML views, PDF and ePub downloads, according to the available data) and Abstracts Views on Vision4Press platform.
Data correspond to usage on the plateform after 2015. The current usage metrics is available 48-96 hours after online publication and is updated daily on week days.
Initial download of the metrics may take a while.