Free Access
Fig. 1.
Download original image
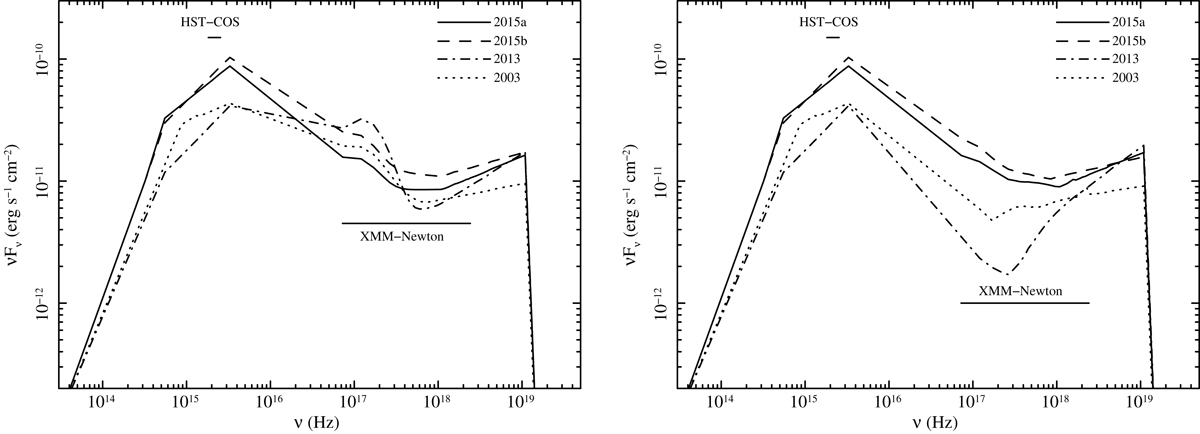
Unobscured (left panel) and obscured (right panel) spectral energy distributions of the 2015a (solid line), 2015b (dashed line), 2013 (dot-dashed line), and 2003 (dotted line) observations. The bands covered by HST-COS and XMM-Newton are also indicated.
Current usage metrics show cumulative count of Article Views (full-text article views including HTML views, PDF and ePub downloads, according to the available data) and Abstracts Views on Vision4Press platform.
Data correspond to usage on the plateform after 2015. The current usage metrics is available 48-96 hours after online publication and is updated daily on week days.
Initial download of the metrics may take a while.