Fig. 8.
Download original image
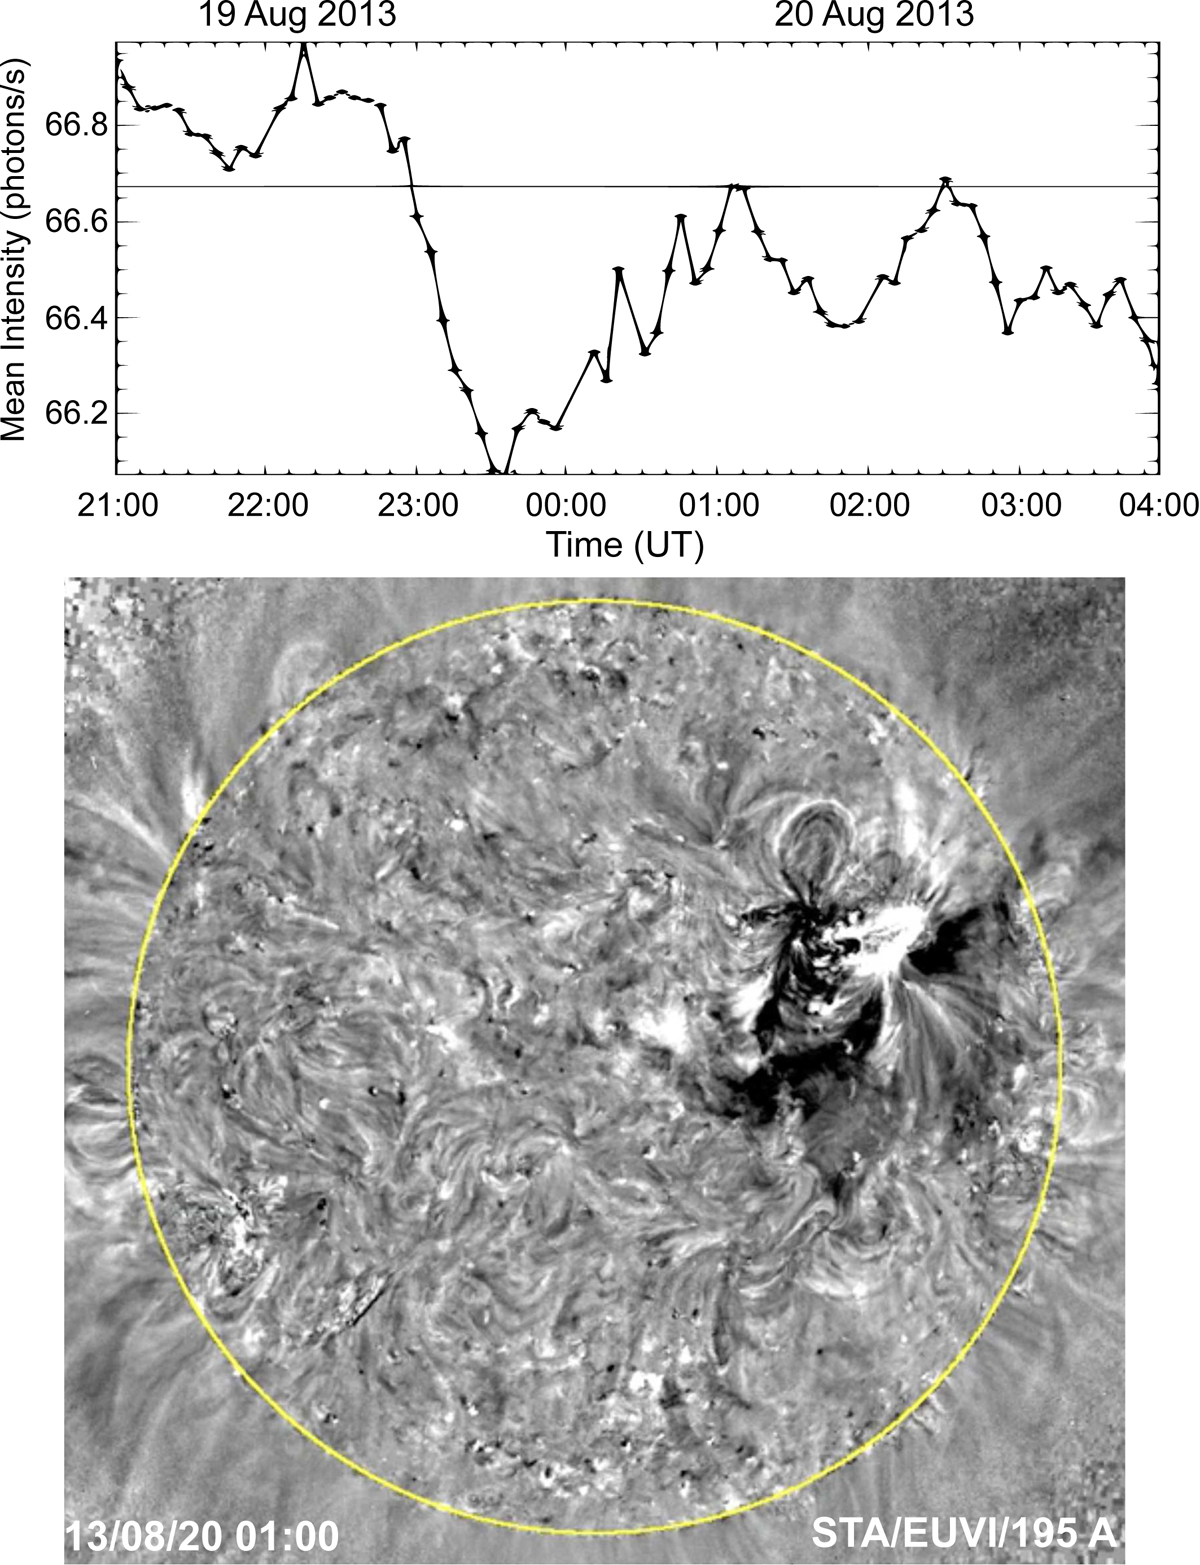
EUVI-A observations and analysis. Top: STEREO-A light curve produced using full-disc EUVI 195 Å images, where the horizontal line marks the mean intensity at 01:00 UT. Bottom: snapshot at 01:00 UT from an EUVI-A 195 Å percentage base-difference movie, where a brightening can be seen in AR6, near the CME dimming area. The yellow circle corresponds to 1 R⊙.
Current usage metrics show cumulative count of Article Views (full-text article views including HTML views, PDF and ePub downloads, according to the available data) and Abstracts Views on Vision4Press platform.
Data correspond to usage on the plateform after 2015. The current usage metrics is available 48-96 hours after online publication and is updated daily on week days.
Initial download of the metrics may take a while.