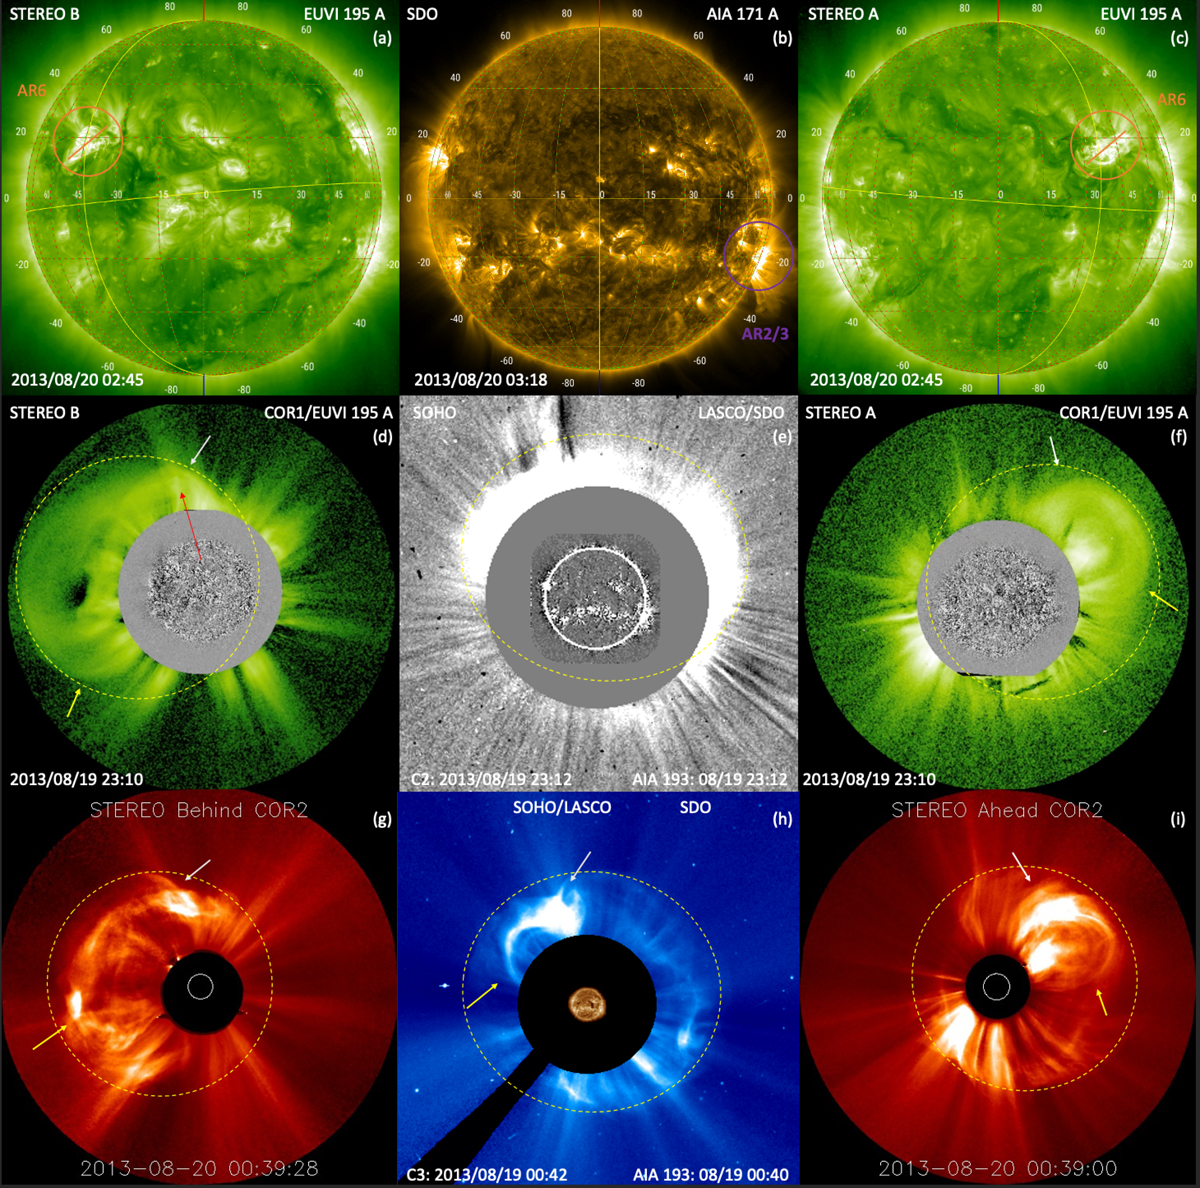
Fig. 7.
Download original image
EUV and coronagraph observations by STEREO-B (left), near-Earth (middle), and STEREO-A (right). Upper panels: EUV images taken by EUVI 195 Å and AIA 171 Å (middle). AR6 is indicated by the orange circle in STEREO-A and STEREO-B, and AR2 and AR3 by the purple circle in SDO. Second and third rows: evolution of the CME at two different times, seen from three different points of view, as observed by the LASCO (magnified image) and SECCHI coronagraphs. The CME-driven shock front is shown with yellow dashed curves (as a rough outline to guide the eye) and the flux-rope structure is indicated with yellow and white arrows. The red arrow indicates the disturbance caused by the first stage (details given in main text). Credit: JHelioviewer/cdaw.gsfc.nasa.gov.
Current usage metrics show cumulative count of Article Views (full-text article views including HTML views, PDF and ePub downloads, according to the available data) and Abstracts Views on Vision4Press platform.
Data correspond to usage on the plateform after 2015. The current usage metrics is available 48-96 hours after online publication and is updated daily on week days.
Initial download of the metrics may take a while.