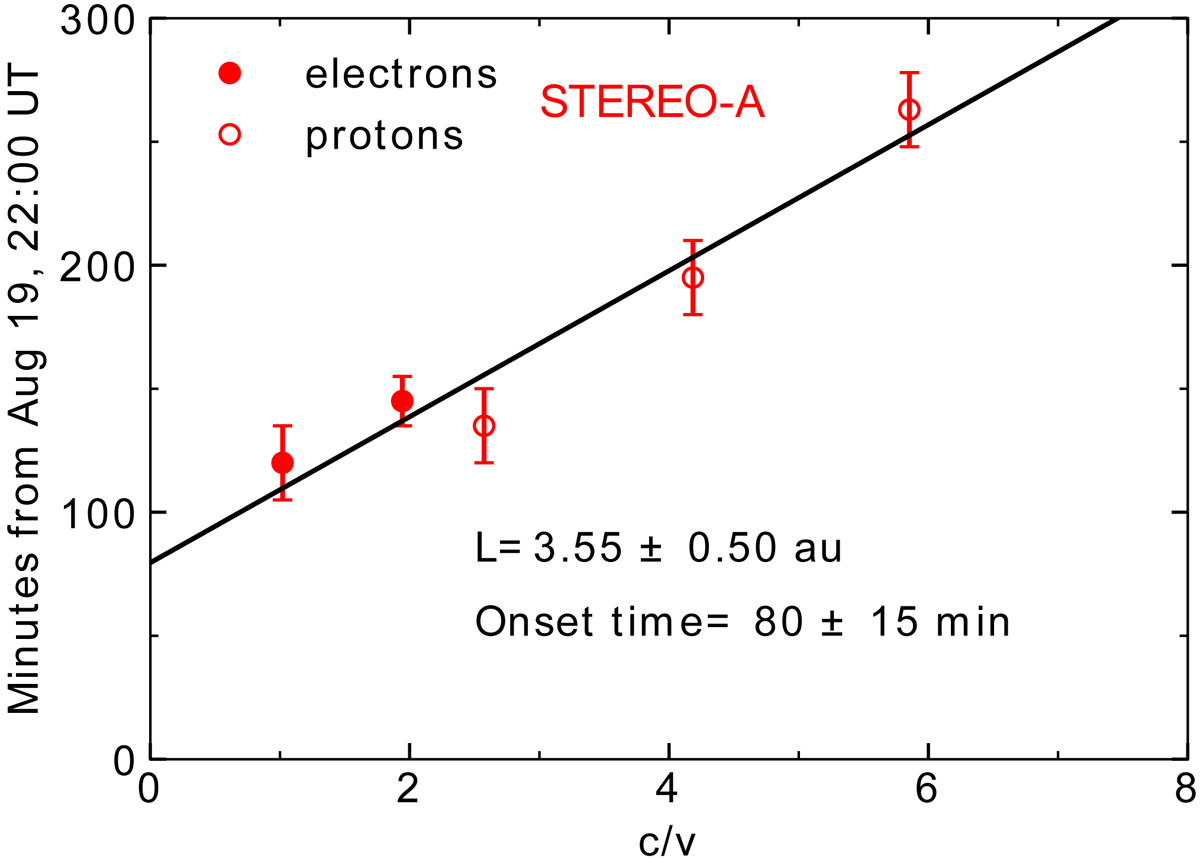
Fig. 6.
Download original image
Velocity dispersion analysis of the onset of the SEP event at STEREO-A. The horizontal and vertical axes correspond to the reciprocal of the particle velocities and onset times, respectively. The red points and circles respectively identify the electron and proton onsets at the corresponding velocities (energies), with the respective errors indicated. The black line is the linear regression fit to all points. The legend gives the effective path length (L) and the estimated release time (onset time) discussed in the text.
Current usage metrics show cumulative count of Article Views (full-text article views including HTML views, PDF and ePub downloads, according to the available data) and Abstracts Views on Vision4Press platform.
Data correspond to usage on the plateform after 2015. The current usage metrics is available 48-96 hours after online publication and is updated daily on week days.
Initial download of the metrics may take a while.