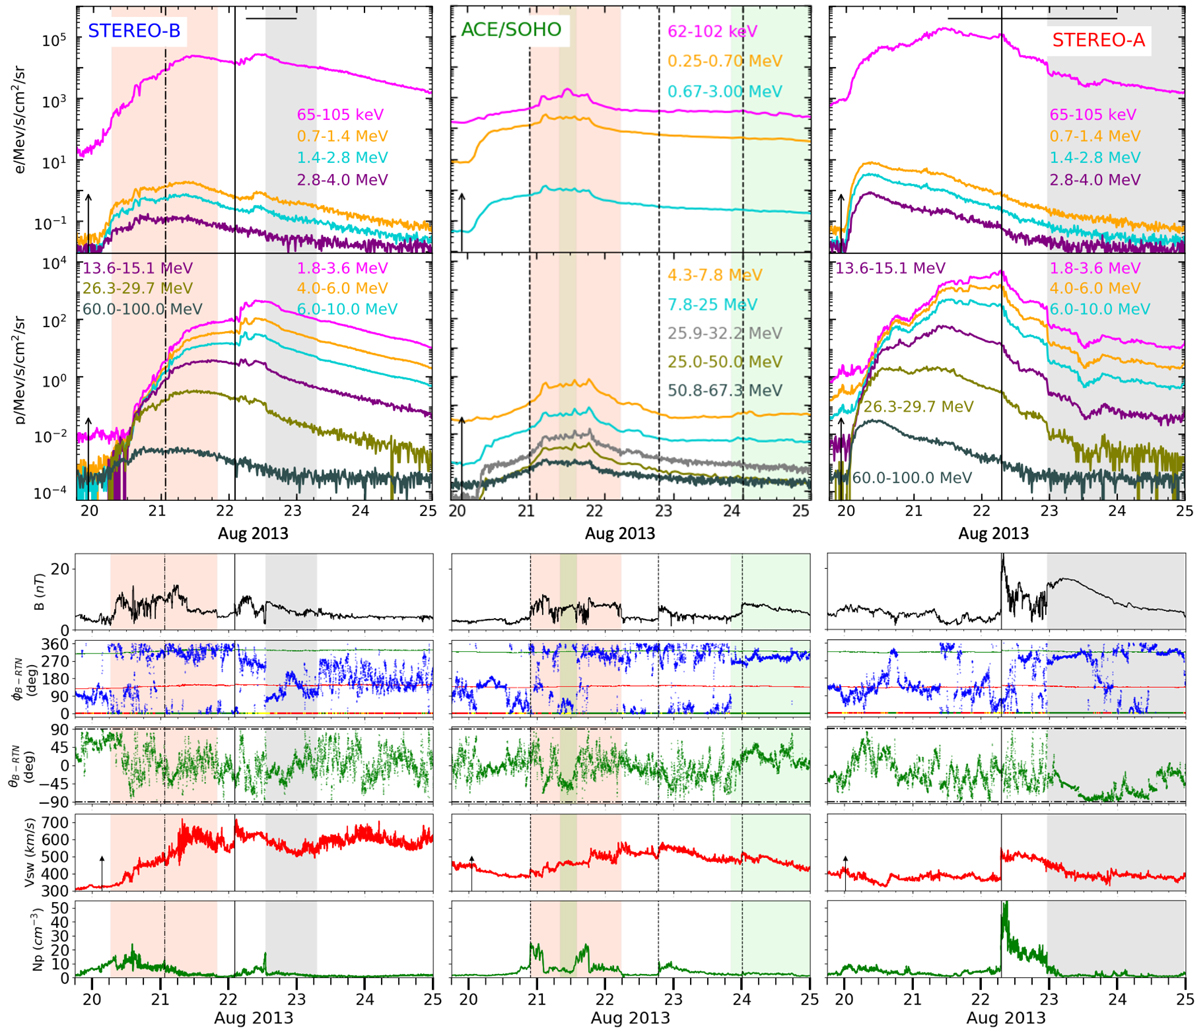
Fig. 2.
Download original image
In situ SEP time profiles and plasma and magnetic field observations by STEREO-B, ACE/SOHO, and STEREO-A. Top: energetic electron and proton temporal profiles observed by, from left to right, STEREO-B, ACE/SOHO, and STEREO-A from comparable energy channels. The CME eruption time is represented by the arrow on the lower x-axis, while the horizontal lines on the upper x-axis of electron panels represent periods of proton contaminating the measured electron fluxes observed by both STEREO. A stream interface observed by STEREO-B is shown as a dash-dotted line, while the salmon shaded areas in STEREO-B and L1 indicate SIRs. The vertical solid lines and grey shaded areas indicate the IP shocks and ICME transits, respectively, associated with the SEP event, based on STEREO ICME list at https://stereo-ssc.nascom.nasa.gov/data/ins_data/impact/level3/. The IP shocks and ICMEs observed near the Earth, not related with the SEP event, are indicated with vertical dashed lines and green shaded areas, and are based on the SOHO CELIAS/MTOF Proton Monitor shock list at http://umtof.umd.edu/pm/FIGS.HTML and the near-Earth ICME list at http://www.srl.caltech.edu/ACE/ASC/DATA/level3/icmetable2.htm, respectively. Bottom: in situ plasma and magnetic field observations by STEREO-B (left), ACE (center), and STEREO-A (right). The panels present, from top to bottom, the magnetic field magnitude, the magnetic field azimuthal and latitudinal angles, ϕB − RTN and θB − RTN, the solar wind speed, and the proton density, where RTN stands for radial-tangential-normal coordinates (e.g., Hapgood 1992). The coloured lines in the ϕB − RTN angle panel indicate the in situ magnetic field polarity, estimated from the magnetic field azimuth. Red and green colours denote inward and outward polarity, respectively. The lower band shows the observed magnetic field polarity, where the yellow intervals represent the periods with the magnetic field oriented close to perpendicular to the nominal Parker spiral. The respective relativistic electron onset times are marked with the arrow in the solar wind proton panel (IP structures as described in top panels).
Current usage metrics show cumulative count of Article Views (full-text article views including HTML views, PDF and ePub downloads, according to the available data) and Abstracts Views on Vision4Press platform.
Data correspond to usage on the plateform after 2015. The current usage metrics is available 48-96 hours after online publication and is updated daily on week days.
Initial download of the metrics may take a while.