Fig. 13.
Download original image
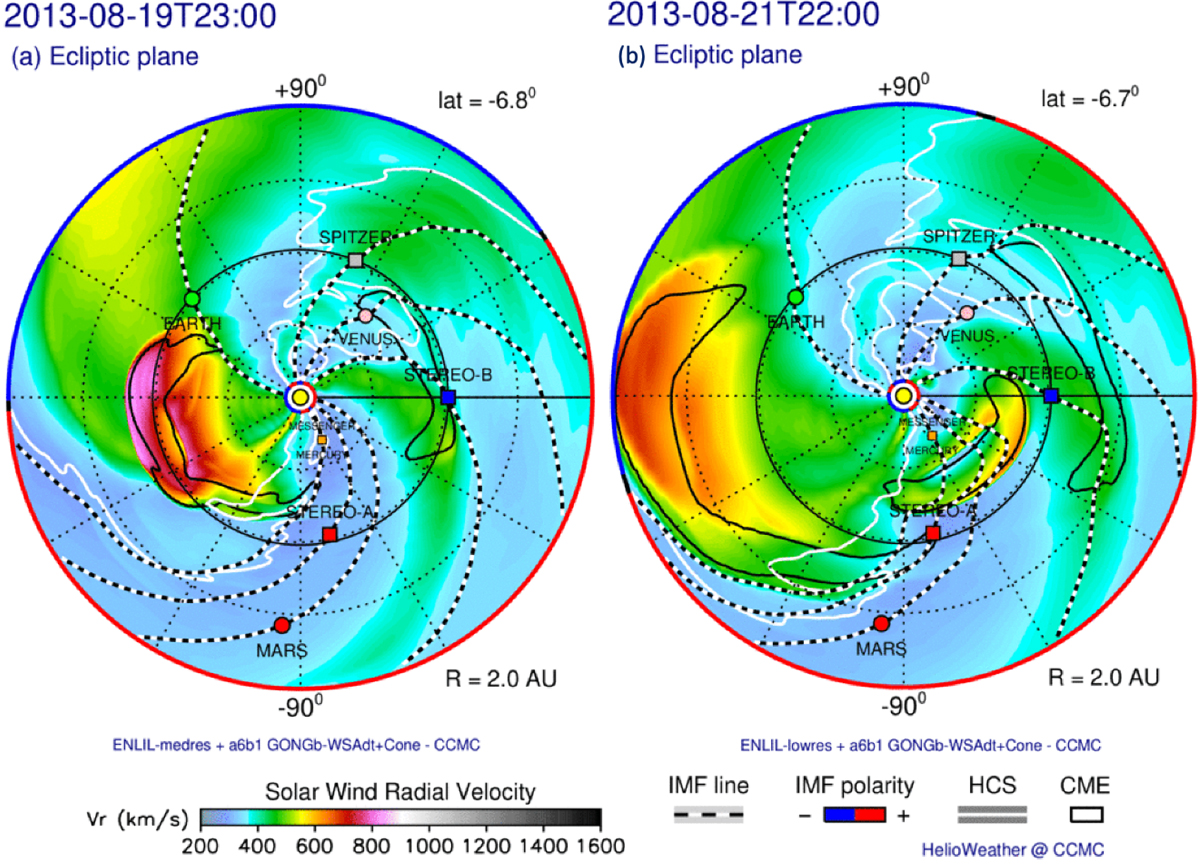
Radial velocity contour plots from the ENLIL simulation in the ecliptic plane. The black and white dashed lines represent the IMF lines and the black contours track the ICMEs. The white lines correspond to the HCS, which separates the regions with opposite magnetic polarity, shown in blue (negative) or red (positive) on the outer edge of the simulation region. Left panel (a): magnetic connectivity of the different spacecraft around the particle solar release time. Right panel (b): magnetic field line connecting STEREO-B intersects for the first time the IP shock driven by the ICME. Credit: CCMC.
Current usage metrics show cumulative count of Article Views (full-text article views including HTML views, PDF and ePub downloads, according to the available data) and Abstracts Views on Vision4Press platform.
Data correspond to usage on the plateform after 2015. The current usage metrics is available 48-96 hours after online publication and is updated daily on week days.
Initial download of the metrics may take a while.