Fig. 11.
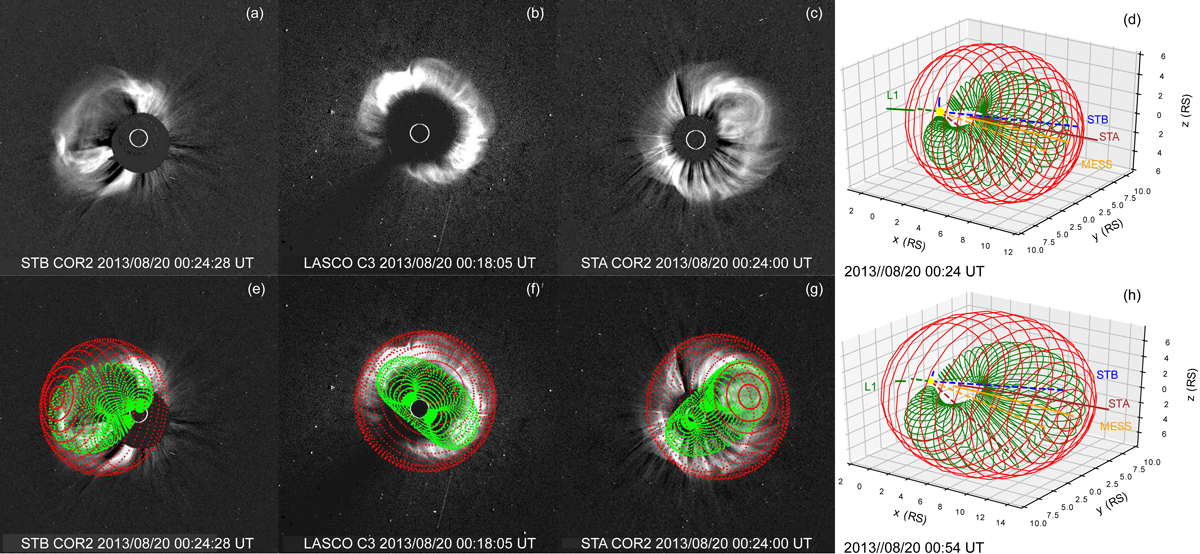
Download original image
Coronagraph images and GCS 3D reconstruction for the CME (green mesh) and associated driven shock (red mesh) as seen via three different instruments: COR2-B (a, e), C3 (b, f) and COR2-A (c, g). The C3 images are magnified for better visualization. The right plots (d, h) show the 3D representation, in HEEQ reference in R⊙, of the CME and the driven shock, together with the nominal Parker spirals (solid lines) and the lines connecting the Sun (dashed lines), for STEREO-A (STA in red), STEREO-B (STB in blue), MESSENGER (MESS in orange), and the Earth (L1 in green). The Sun is shown as a yellow circle (not to scale).
Current usage metrics show cumulative count of Article Views (full-text article views including HTML views, PDF and ePub downloads, according to the available data) and Abstracts Views on Vision4Press platform.
Data correspond to usage on the plateform after 2015. The current usage metrics is available 48-96 hours after online publication and is updated daily on week days.
Initial download of the metrics may take a while.