Fig. 10.
Download original image
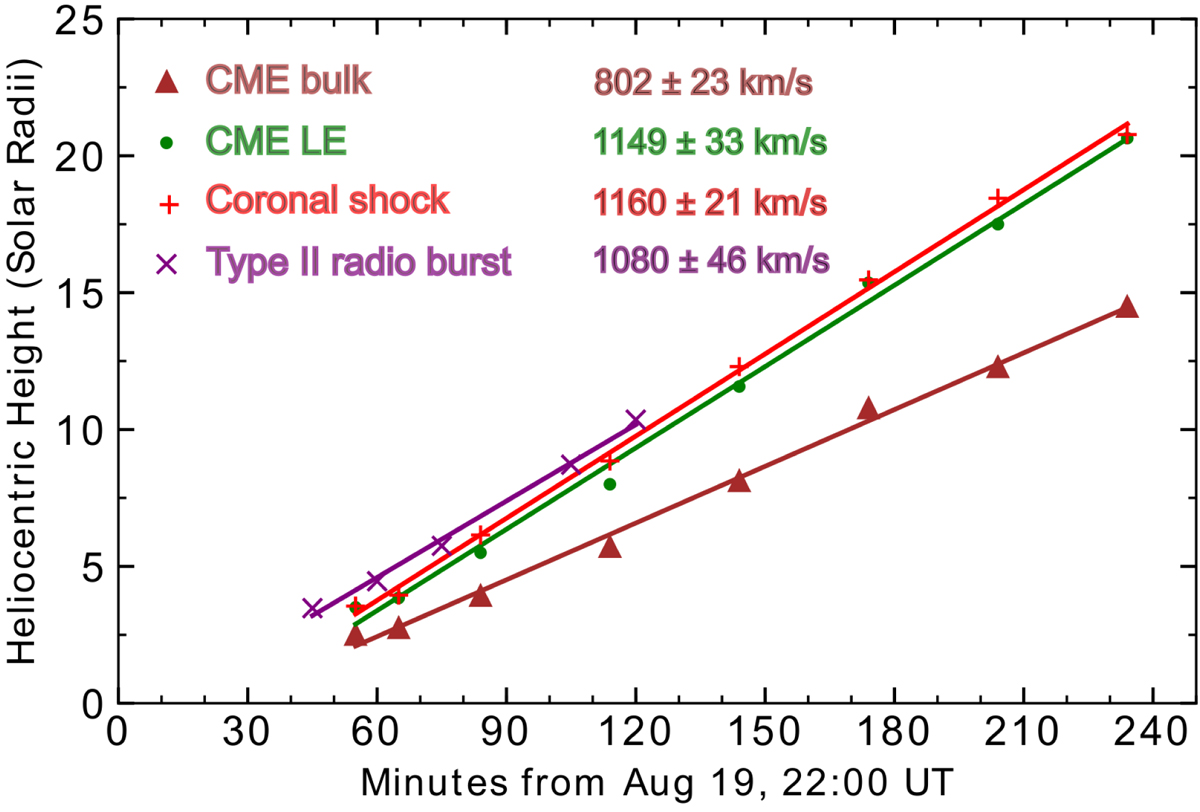
Height evolution of the CME bulk and LE, coronal shock, and type II radio burst. The brown, green, and red lines show the CME (bulk and LE) and coronal shock height fits, respectively, from GCS and spheroid reconstruction. Type II radio burst drift, using the hybrid density model, is represented by the purple line (details given in main text). The legend shows the speeds corresponding to each linear fit.
Current usage metrics show cumulative count of Article Views (full-text article views including HTML views, PDF and ePub downloads, according to the available data) and Abstracts Views on Vision4Press platform.
Data correspond to usage on the plateform after 2015. The current usage metrics is available 48-96 hours after online publication and is updated daily on week days.
Initial download of the metrics may take a while.