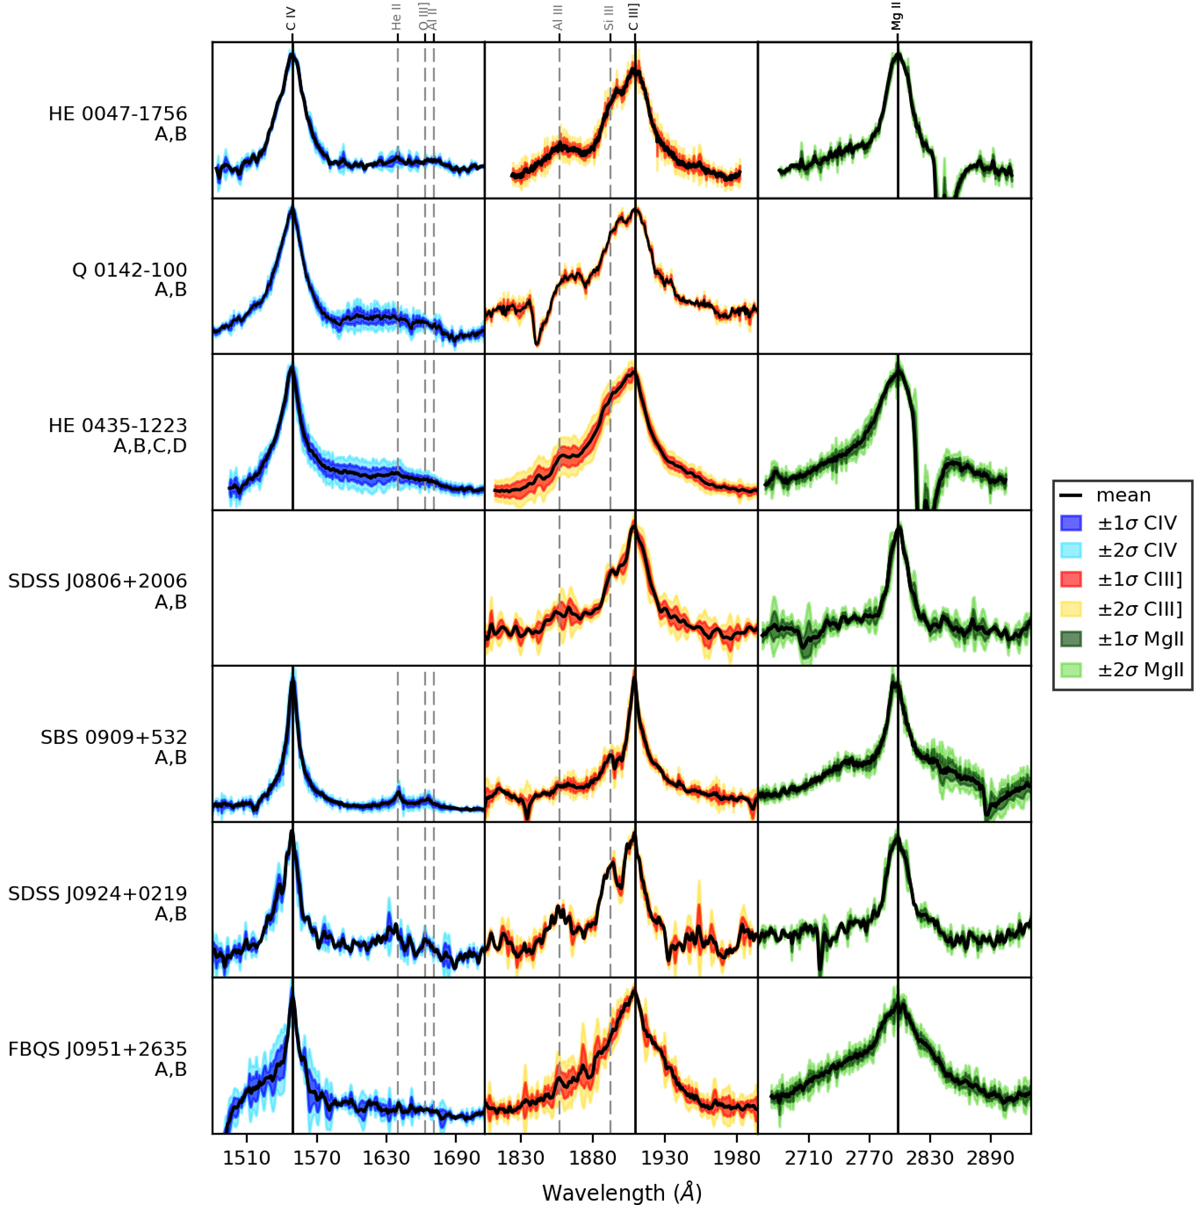
Fig. 2.
Download original image
Average (black) spectra for the C IV, C III], and Mg II emission lines with one (dark blue, red, and green) and two (light blue, red, and green) sigma intervals. We did not take into account noisy spectra and spectra that show absorption features in the line core (as in the case of Mg II in SDSS J1004+4112). The y-axis is in arbitrary units of flux.
Current usage metrics show cumulative count of Article Views (full-text article views including HTML views, PDF and ePub downloads, according to the available data) and Abstracts Views on Vision4Press platform.
Data correspond to usage on the plateform after 2015. The current usage metrics is available 48-96 hours after online publication and is updated daily on week days.
Initial download of the metrics may take a while.