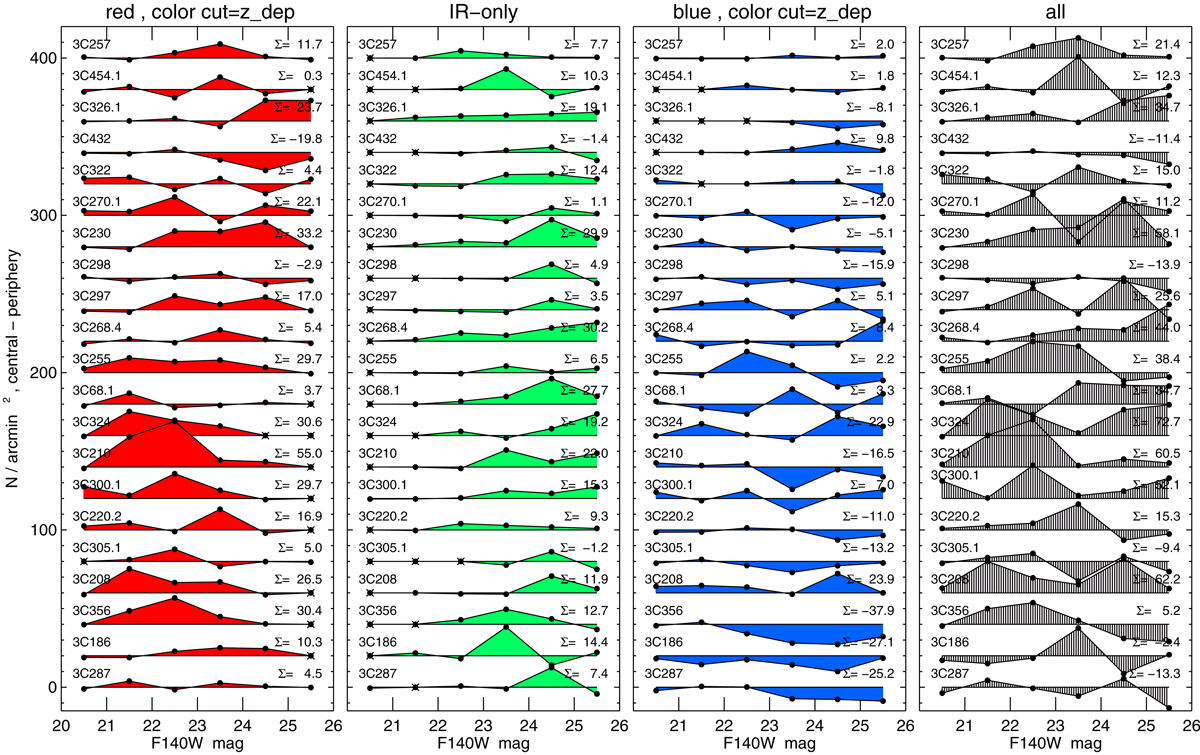
Fig. 8.
Download original image
Central overdensities (COD) versus brightness for the red, IR-only, blue and all subsamples. Each row plots the COD around the labeled 3C source, which are sorted by redshift. The rows are subsequently shifted vertically by 20 arcmin−2. The total COD integrated over the brightness range is labeled as Σ. The 3C sources themselves have been excluded from the counts. The brightness bins have a width of 1 mag, which results in small numbers of objects per bin. A COD of N = 5 per square arcmin translates to 1 galaxy per cell of r = 15″.
Current usage metrics show cumulative count of Article Views (full-text article views including HTML views, PDF and ePub downloads, according to the available data) and Abstracts Views on Vision4Press platform.
Data correspond to usage on the plateform after 2015. The current usage metrics is available 48-96 hours after online publication and is updated daily on week days.
Initial download of the metrics may take a while.