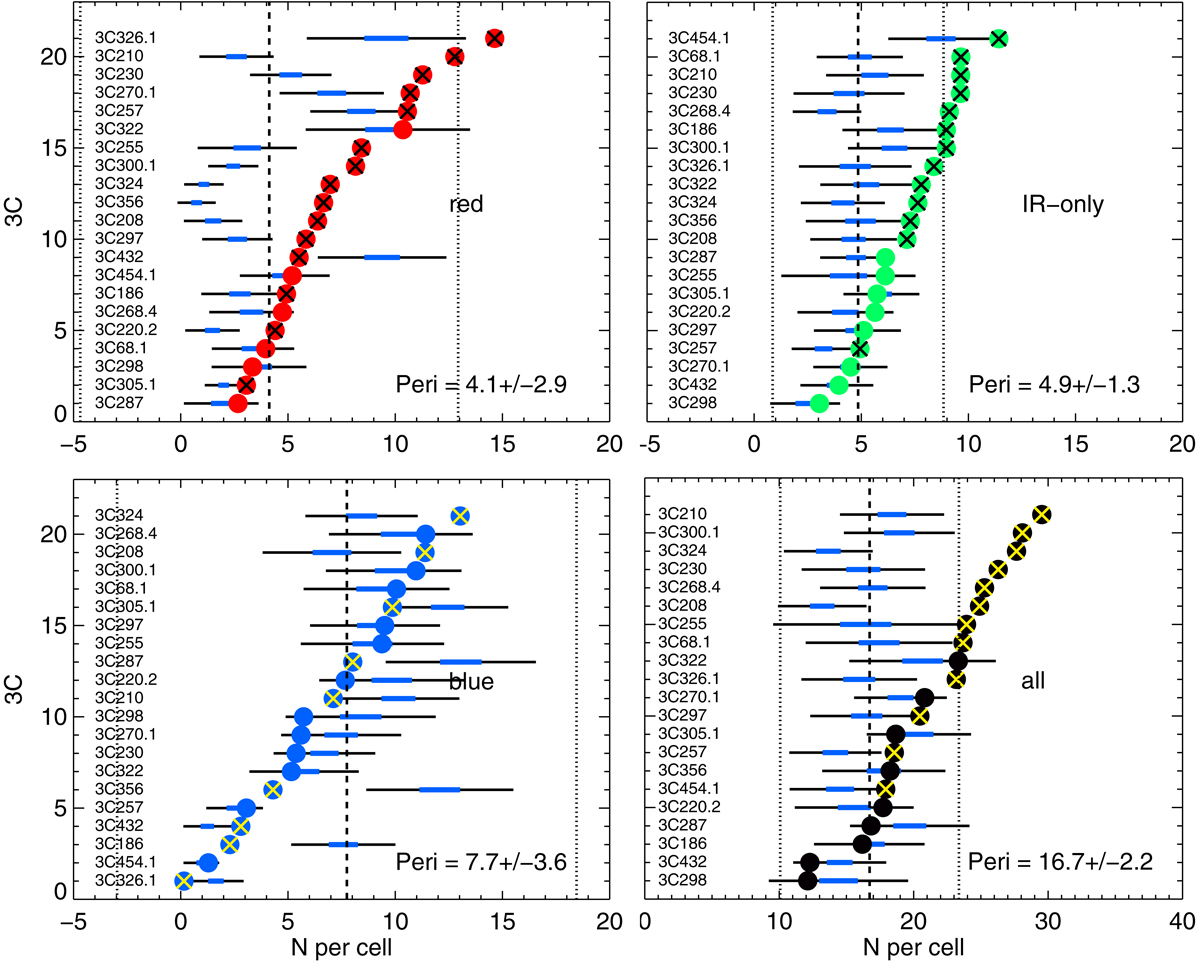
Fig. 7.
Download original image
Frequency of central overdensities for the red, IR-only, blue, and all samples for the brightness range 20 < F140W < 26, rc = 15″. In each panel, the 3C sources are sorted by the central surface density (vertical axis). For each 3C source, the horizontal axis shows the surface density of the center (SDC, filled circle) and of the periphery (SDP, horizontal bar with standard deviation as black bar and EoM as thicker blue bar) using values from Table B.2. Crosses within the symbols indicate whether the COD is significant according to approach 1, as described in the text. The vertical lines mark the average of the periphery calculated over all 3C sources (long-dashed line) and the 3σ range (dotted line); the corresponding values are shown in the lower right corner.
Current usage metrics show cumulative count of Article Views (full-text article views including HTML views, PDF and ePub downloads, according to the available data) and Abstracts Views on Vision4Press platform.
Data correspond to usage on the plateform after 2015. The current usage metrics is available 48-96 hours after online publication and is updated daily on week days.
Initial download of the metrics may take a while.