Fig. 6.
Download original image
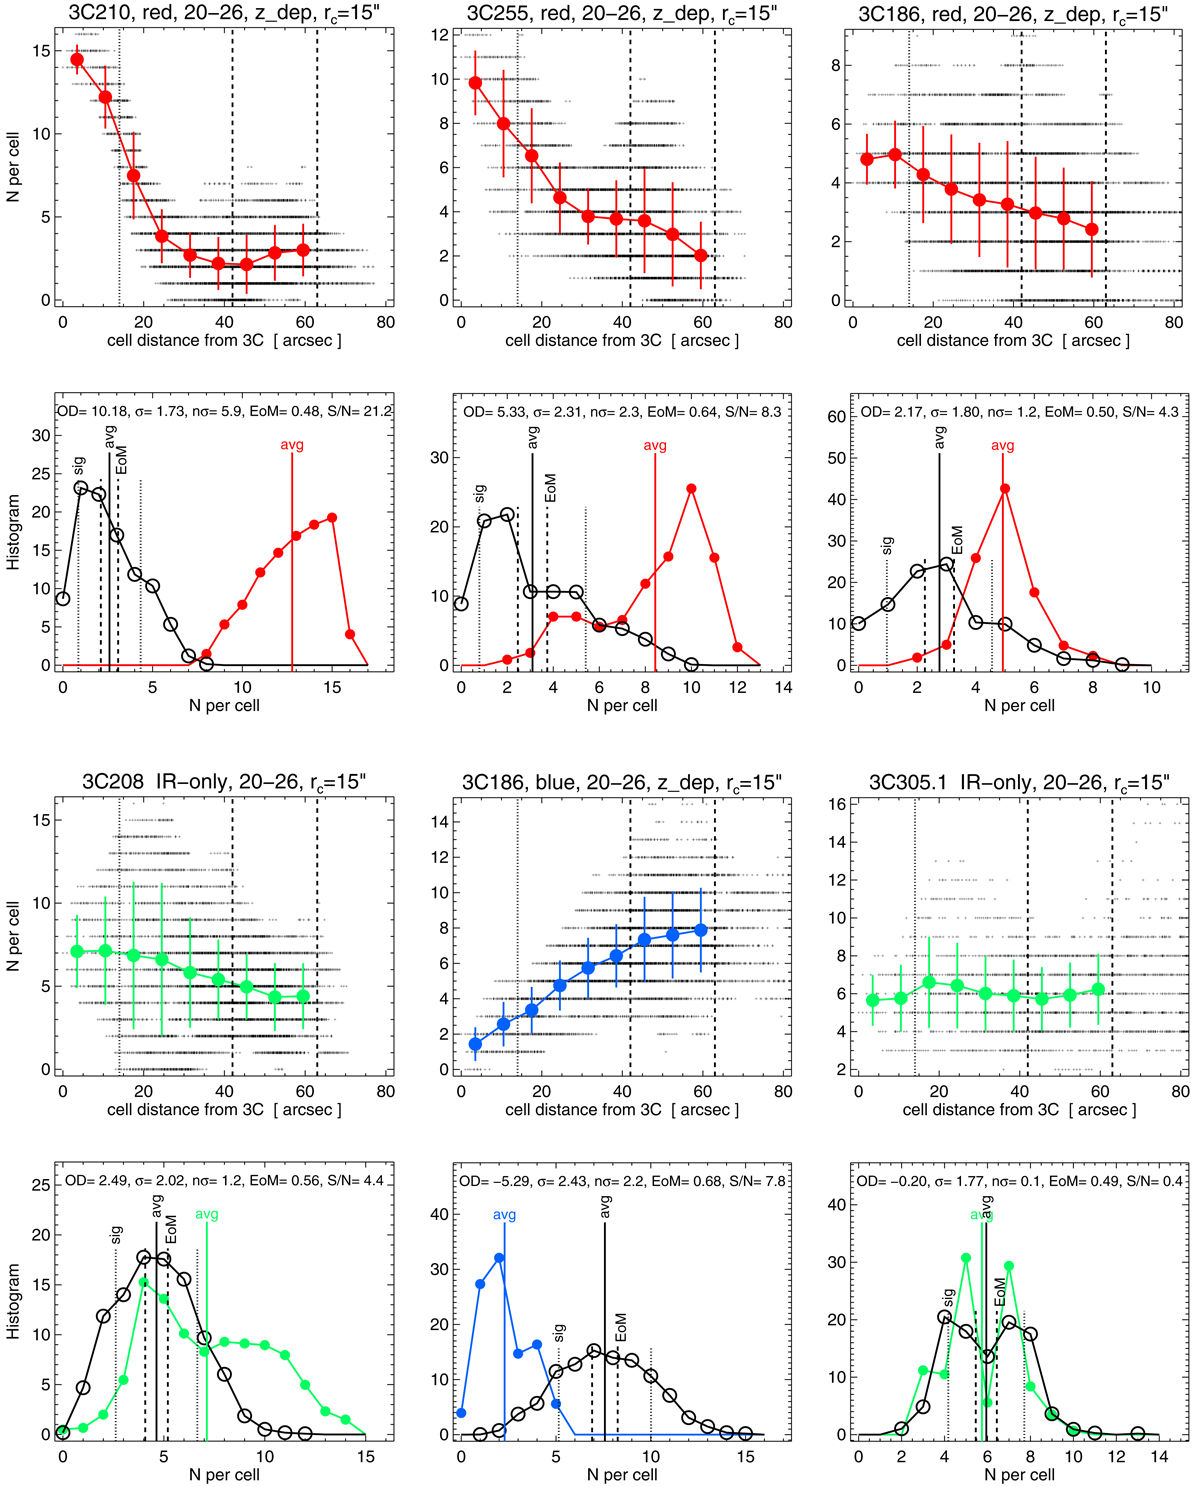
Radial surface density profiles and histograms from the cell counts in Sect. 3.2 for six examples. Top panel: the small “+” symbols mark individual cells, while the colored lines and filled symbols show the mean radial profile and standard deviation. The vertical black dotted and dashed lines mark the radial limits used to define the central region and periphery. Bottom: histogram of the cell counts (made from the “+” in the top row), colored with filled circles for the center and black open circles for the periphery. The vertical lines indicate the average (avg), and for the periphery also the standard deviation (1σ) around the avg and its uncertainty (= error of the mean, ![]() , assuming Nic = 13 independent cells in the periphery). These statistical values are written at the top of the histogram (S/N = OD/EoM).
, assuming Nic = 13 independent cells in the periphery). These statistical values are written at the top of the histogram (S/N = OD/EoM).
Current usage metrics show cumulative count of Article Views (full-text article views including HTML views, PDF and ePub downloads, according to the available data) and Abstracts Views on Vision4Press platform.
Data correspond to usage on the plateform after 2015. The current usage metrics is available 48-96 hours after online publication and is updated daily on week days.
Initial download of the metrics may take a while.