Fig. 5.
Download original image
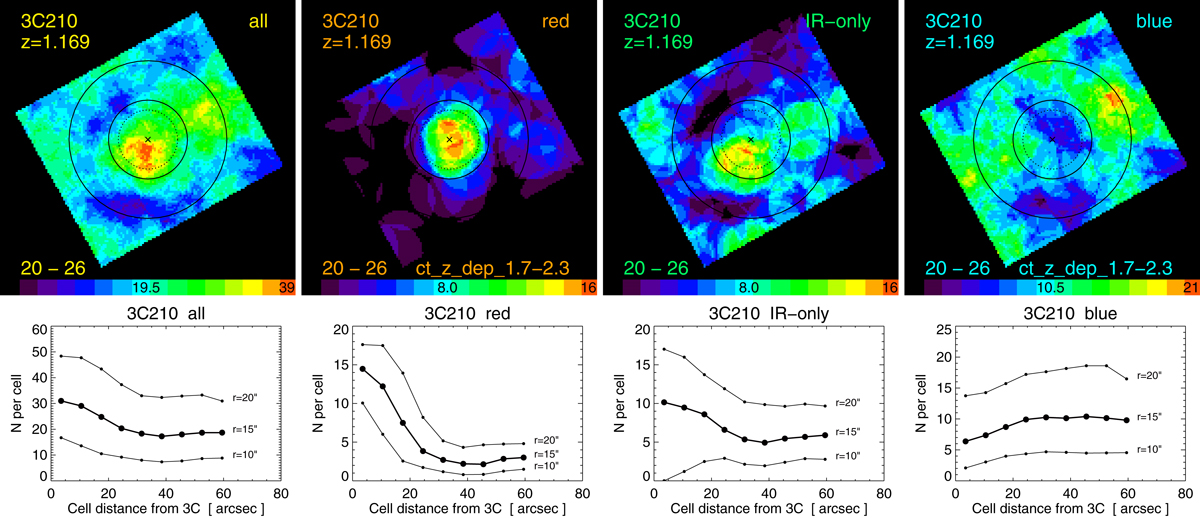
Surface density maps and radial density profiles of the 3C 210 field. Top row: surface density maps for four selection criteria. These are from left to right: all galaxies, red, IR-only and blue galaxies; for red and blue galaxies we used the redshift-dependent color threshold as labeled in the bottom right corner. The magnitude range is 20 < F140W < 26 as labeled in the bottom left corner. The map size is 2.5′, north is up, east to the left. The black cross marks the position of the 3C source. The 3C source is used only as a signpost for a density enhancement and is therefore excluded from the density maps and all further density calculations. The dotted circle indicates the cell size (rc = 15″), and the two solid circles mark a radius of 20″ and 40″ around the 3C source. The color bar at the bottom of the maps gives the linear range used for the map: from N = 0 (black, left end) to the maximal surface density per cell as labeled at the right end of the bar (red); light blue gives the numbers as labeled in the middle of the color bar. Bottom row: mean radial surface density per cell as a function of distance from the 3C source. The radial surface density is plotted for three different cell sizes. The thick line with large dots marks the curve for cell radius rc = 15″, which was used for the maps shown. The two other curves are for rc = 10″ and r = 20″, without area normalization, to avoid confusion of the three curves.
Current usage metrics show cumulative count of Article Views (full-text article views including HTML views, PDF and ePub downloads, according to the available data) and Abstracts Views on Vision4Press platform.
Data correspond to usage on the plateform after 2015. The current usage metrics is available 48-96 hours after online publication and is updated daily on week days.
Initial download of the metrics may take a while.