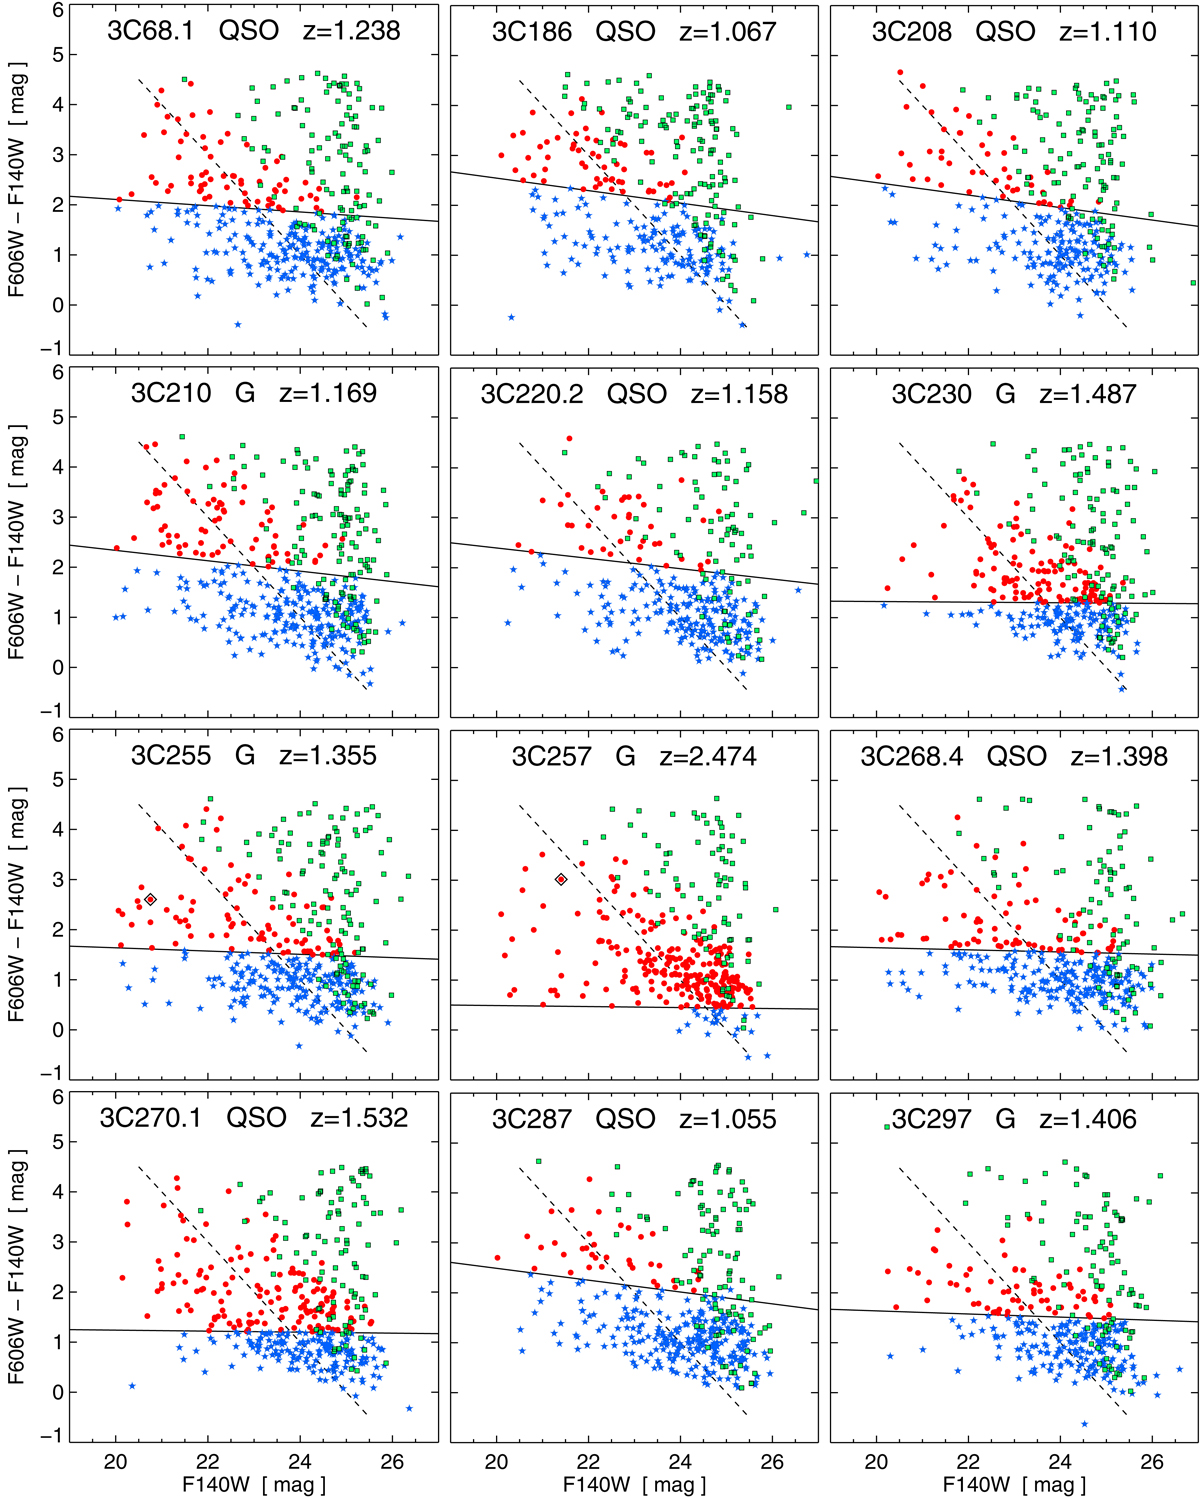
Fig. 4.
Download original image
Color–magnitude diagrams (CMDs) for the 3C fields. The labels list the 3C name, type (galaxy or quasar), and redshift. The 3C source is shown as a black diamond if it fits into the plot range (3C 255, 3C 257, 3C 322, 3C 326.1). Red dots and blue stars denote sources in the two-filter catalog, separated by the redshift-dependent color cut (solid black line). The F140W error bars are typically smaller than the size of the symbols but slightly exceed them at the faint end (1σ < 0.3 mag). The color error bars may be larger, reaching 1σ = 0.45 mag, but are not plotted here to avoid confusion. The green symbols mark the sources of the single-filter sample, henceforth denoted the IR-only sample, most of which are fainter than 24 mag. Although their colors are unknown, to illustrate how numerous these sources are they have been randomly assigned colors to fill the upper right quadrant of the CMD. The dashed line marks the 75% color completeness limit, derived from the 3σ detected two-filter sample at F606W = 25 mag and F140W = 23 mag (Table 2) and assuming a slope of −1.
Current usage metrics show cumulative count of Article Views (full-text article views including HTML views, PDF and ePub downloads, according to the available data) and Abstracts Views on Vision4Press platform.
Data correspond to usage on the plateform after 2015. The current usage metrics is available 48-96 hours after online publication and is updated daily on week days.
Initial download of the metrics may take a while.