Fig. 2.
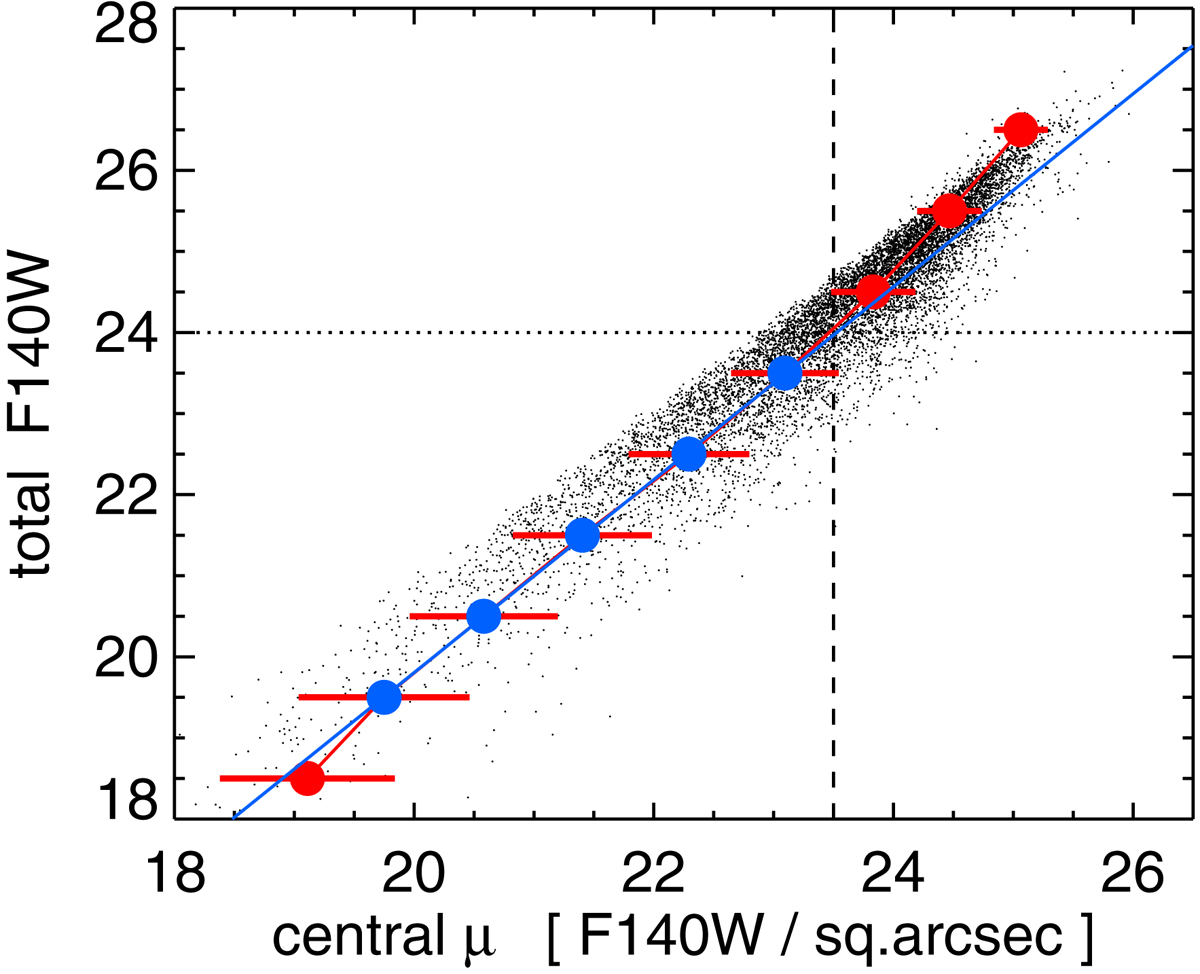
Download original image
Total F140W magnitude vs. μ. Each galaxy is plotted by a tiny black dot, altogether forming the “galaxy cloud”. The vertical dashed line marks the surface brightness completeness limit at μcl ∼ 23.5. Because the galaxy cloud does not exhibit a sharp boundary at this completeness limit, we proceed as follows: The thick red and blue dots mark the average and standard deviation of μ in the total F140W bins (e.g., 18 < F140W < 19 plotted at F140W = 18.5). The solid blue line is a linear fit through the thick blue dots, which are brighter than μcl. The intersection of the solid blue line with μcl yields a total F140W value ∼24 (horizontal dotted line). At F140W ∼ 24, a large fraction of the galaxy cloud lies right of μcl and therefore suffers from surface brightness incompleteness. The total F140W completeness limit (100%) is likely about 1 mag brighter at 23 mag, where the galaxy cloud is brighter than μcl.
Current usage metrics show cumulative count of Article Views (full-text article views including HTML views, PDF and ePub downloads, according to the available data) and Abstracts Views on Vision4Press platform.
Data correspond to usage on the plateform after 2015. The current usage metrics is available 48-96 hours after online publication and is updated daily on week days.
Initial download of the metrics may take a while.