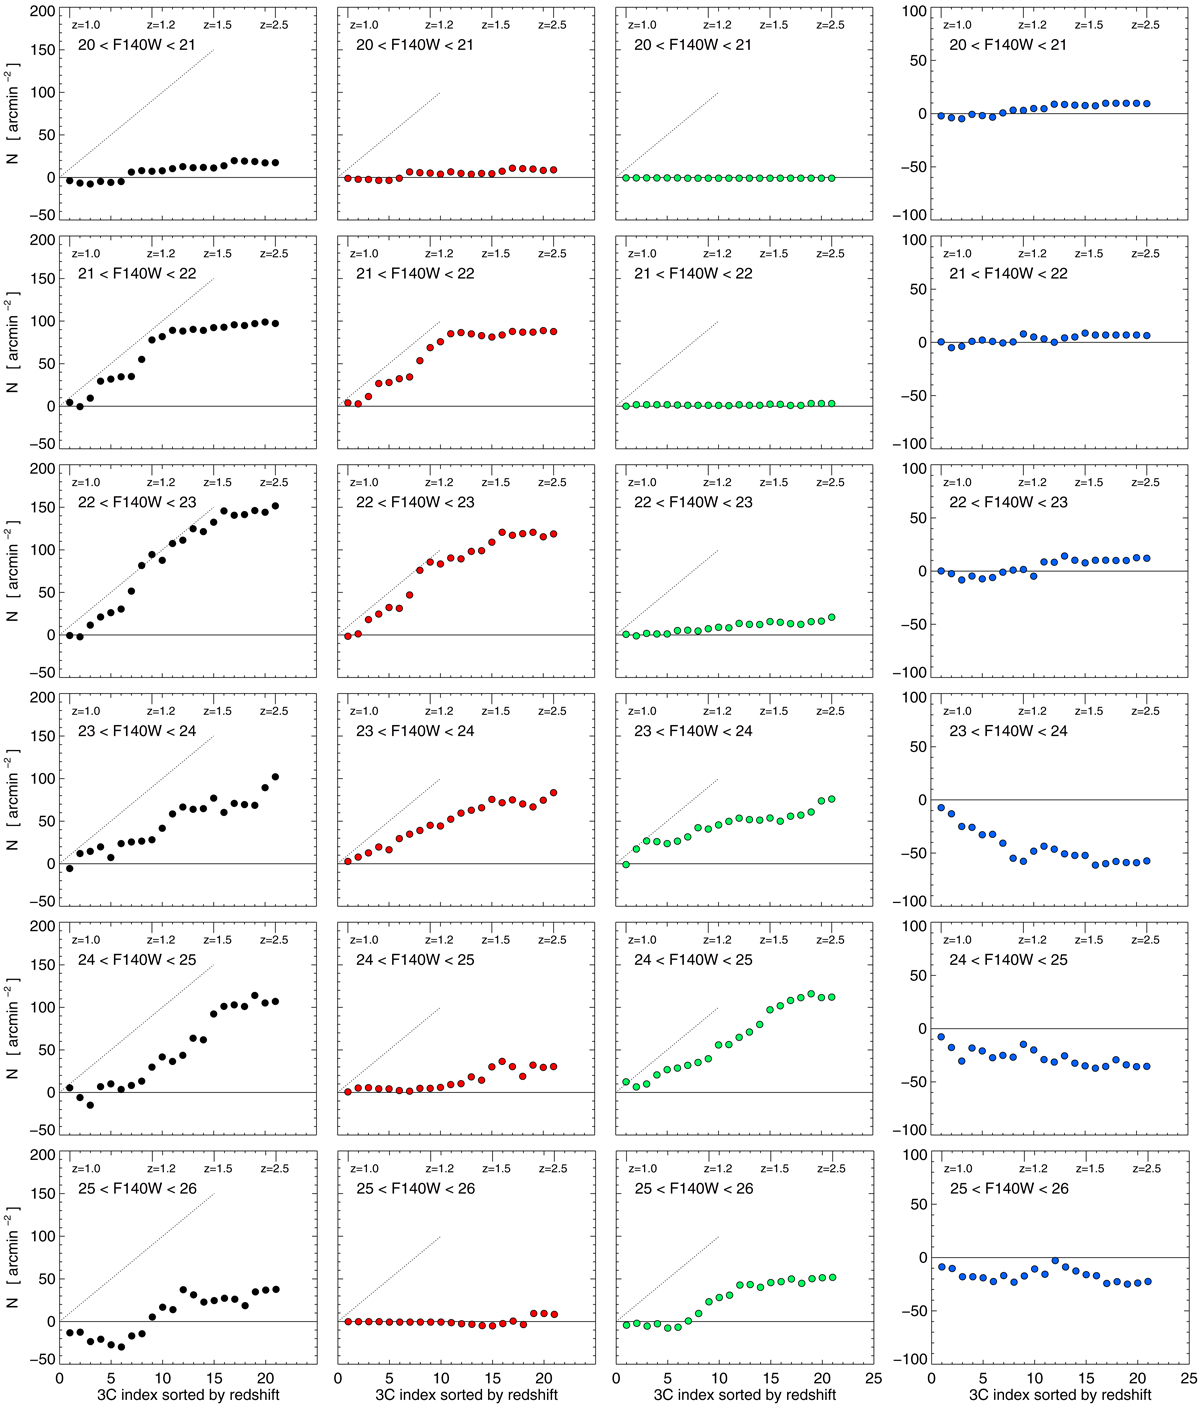
Fig. 11.
Download original image
Cumulative central overdensities for different brightness and the samples all, red, IR-only, and blue (from left to right). The 3C sources are excluded from the counts. The horizontal axis is the index of the 3C source, sorted by redshift, as labeled at the top of each panel. The diagonal dotted line marks a slope of a cumulative central overdensity of s = 10 galaxies per square arcmin per 3C field (∼2 galaxies per cell of 15″ radius, for comparison with Fig. 9). For the blue sample, the vertical axis is shifted and zoomed compared to the other three samples.
Current usage metrics show cumulative count of Article Views (full-text article views including HTML views, PDF and ePub downloads, according to the available data) and Abstracts Views on Vision4Press platform.
Data correspond to usage on the plateform after 2015. The current usage metrics is available 48-96 hours after online publication and is updated daily on week days.
Initial download of the metrics may take a while.