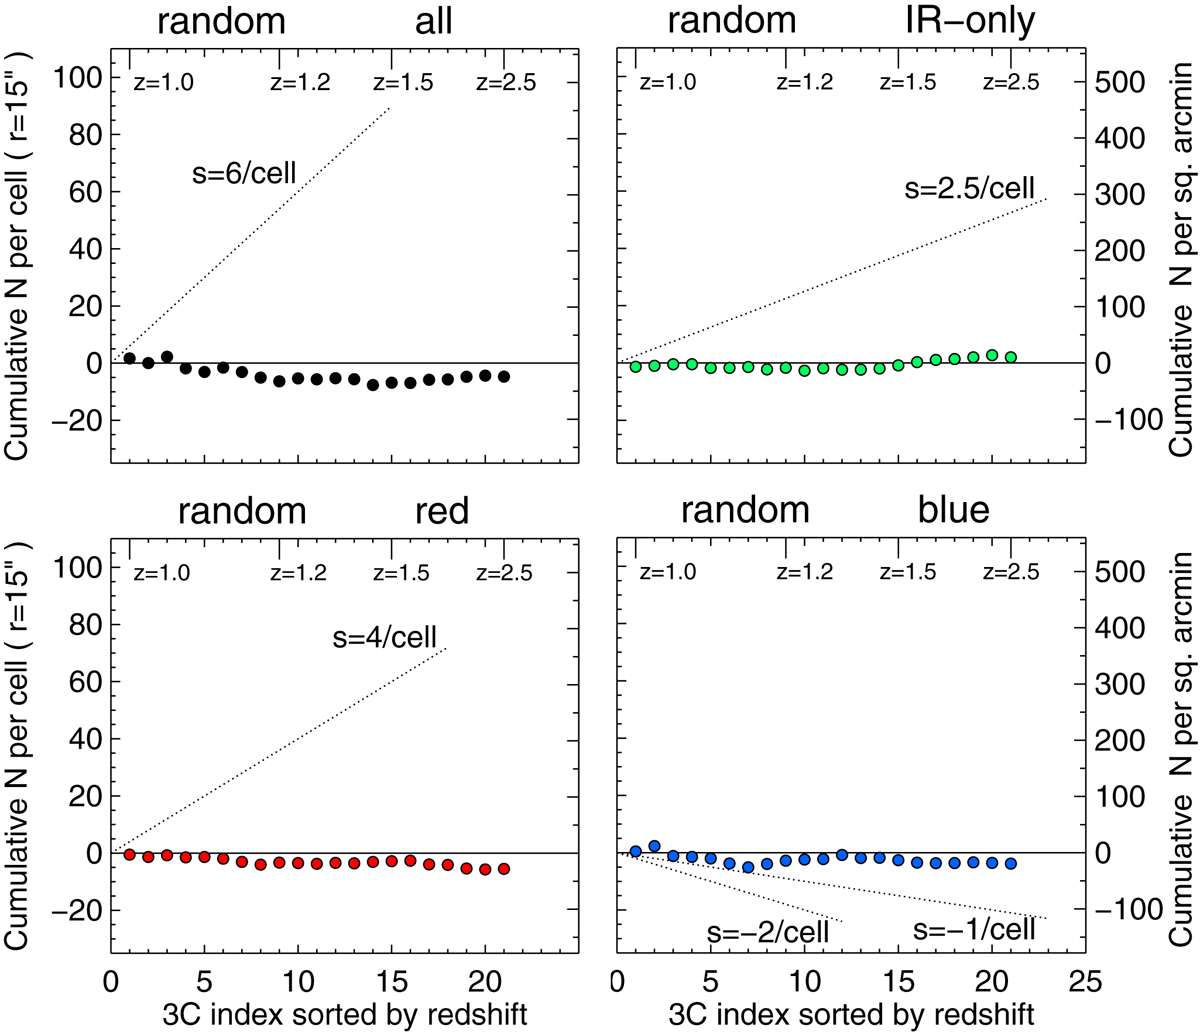
Fig. 10.
Download original image
Result of calculating the central overdensities and their cumulative diagrams for randomized positions of the 3C sources. The average counts per cell were determined from 10 random realizations for all four subsamples, as indicated. We note the disappearance of the cumulative overdensity in comparison to Fig. 9. The dotted lines mark slopes as in Fig. 9.
Current usage metrics show cumulative count of Article Views (full-text article views including HTML views, PDF and ePub downloads, according to the available data) and Abstracts Views on Vision4Press platform.
Data correspond to usage on the plateform after 2015. The current usage metrics is available 48-96 hours after online publication and is updated daily on week days.
Initial download of the metrics may take a while.