Fig. 9.
Download original image
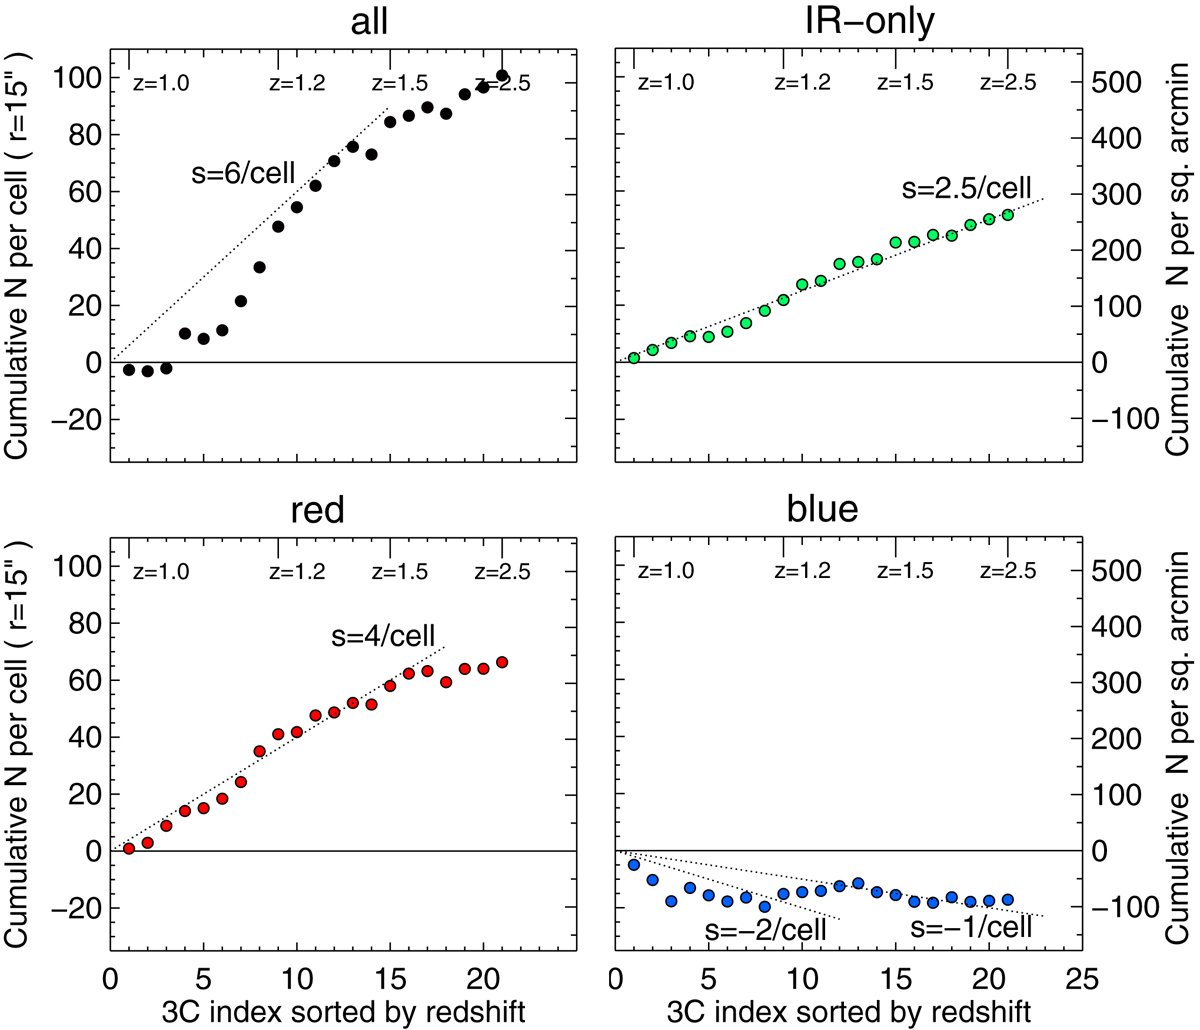
Cumulative central overdensities of the all, red, IR-only and blue samples for the brightness range 20 < F140W < 26 and cell radius rc = 15″. The 3C sources are not included in the counts. The horizontal axis displays the index of each 3C source, sorted by redshift, as labeled at the top of each panel. To guide the eye, the diagonal dotted lines mark slopes of an average central overdensity of s galaxies per cell per 3C field, where the value of s is shown in each panel.
Current usage metrics show cumulative count of Article Views (full-text article views including HTML views, PDF and ePub downloads, according to the available data) and Abstracts Views on Vision4Press platform.
Data correspond to usage on the plateform after 2015. The current usage metrics is available 48-96 hours after online publication and is updated daily on week days.
Initial download of the metrics may take a while.