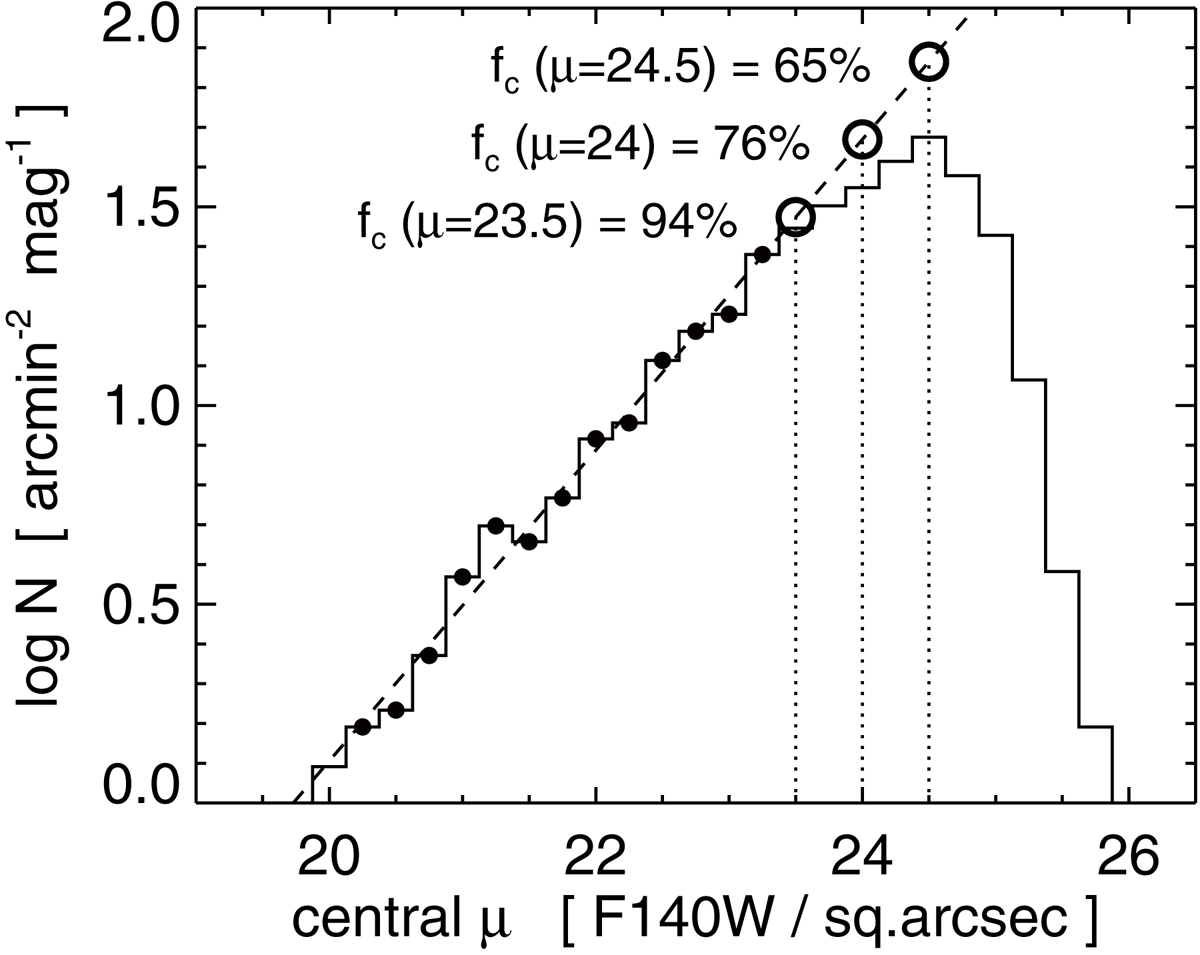
Fig. 1.
Download original image
Log(N) versus central surface brightness μ for F140W. The dashed line is a linear fit for 20 < μ < 23.25 (small dots). At μ ≥ 23.5, the histogram declines below the dashed line due to incompleteness. The completeness fractions are calculated as fc = 10data/10fit for three values of μ as labeled and marked with the dotted vertical lines and open circles at the intersection with the dashed line.
Current usage metrics show cumulative count of Article Views (full-text article views including HTML views, PDF and ePub downloads, according to the available data) and Abstracts Views on Vision4Press platform.
Data correspond to usage on the plateform after 2015. The current usage metrics is available 48-96 hours after online publication and is updated daily on week days.
Initial download of the metrics may take a while.