Fig. B.2.
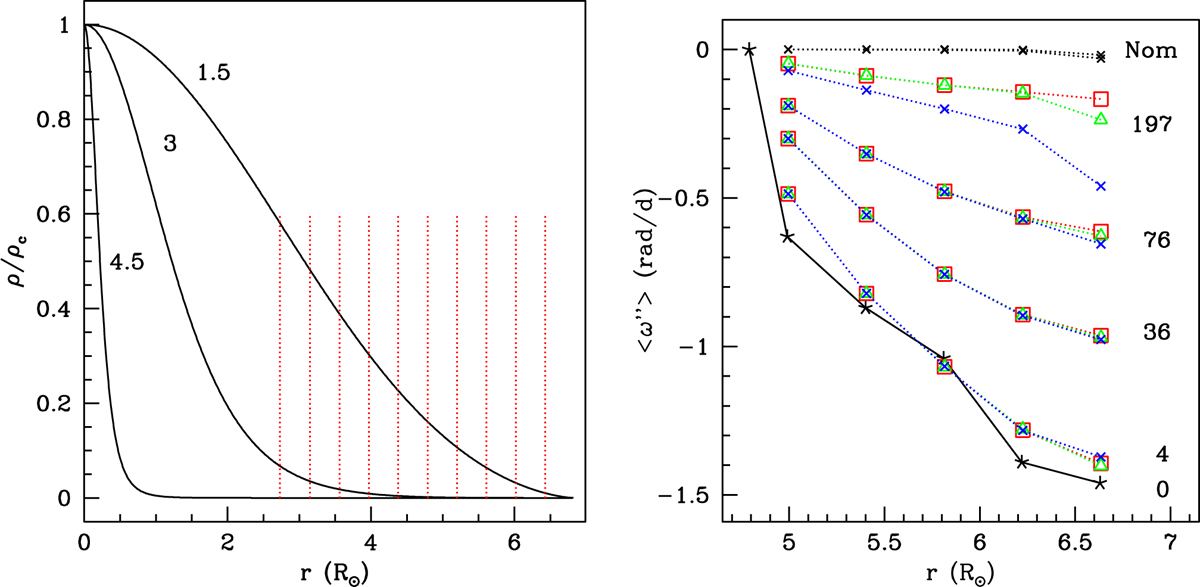
Download original image
Tests performed for different polytropic indices n, where γ = 1+1/n, the exponent of the polytropic equation of state. Left: Polytropic density structures as a function of radius for the 6.84 R⊙ models. Density is given in units of ρc, the central density. Each curve is labeled with its corresponding value of n. The vertical lines indicate the base of layers for layer thickness ΔR/R1 = 0.06. Right: Azimuthally averaged angular velocity ⟨ω″⟩ for n = 1.5 (square, Case 1), 3.0 (triangle, Case 32b) and 4.5 (large cross, Case 51). Illustrated are the values for times t/day = 4, 36, 76, and 197 after the start of the calculation, showing that all cases converge toward average uniform rotation. The initial ω″ profile is shown with the asterisks joined by a continuous line.
Current usage metrics show cumulative count of Article Views (full-text article views including HTML views, PDF and ePub downloads, according to the available data) and Abstracts Views on Vision4Press platform.
Data correspond to usage on the plateform after 2015. The current usage metrics is available 48-96 hours after online publication and is updated daily on week days.
Initial download of the metrics may take a while.