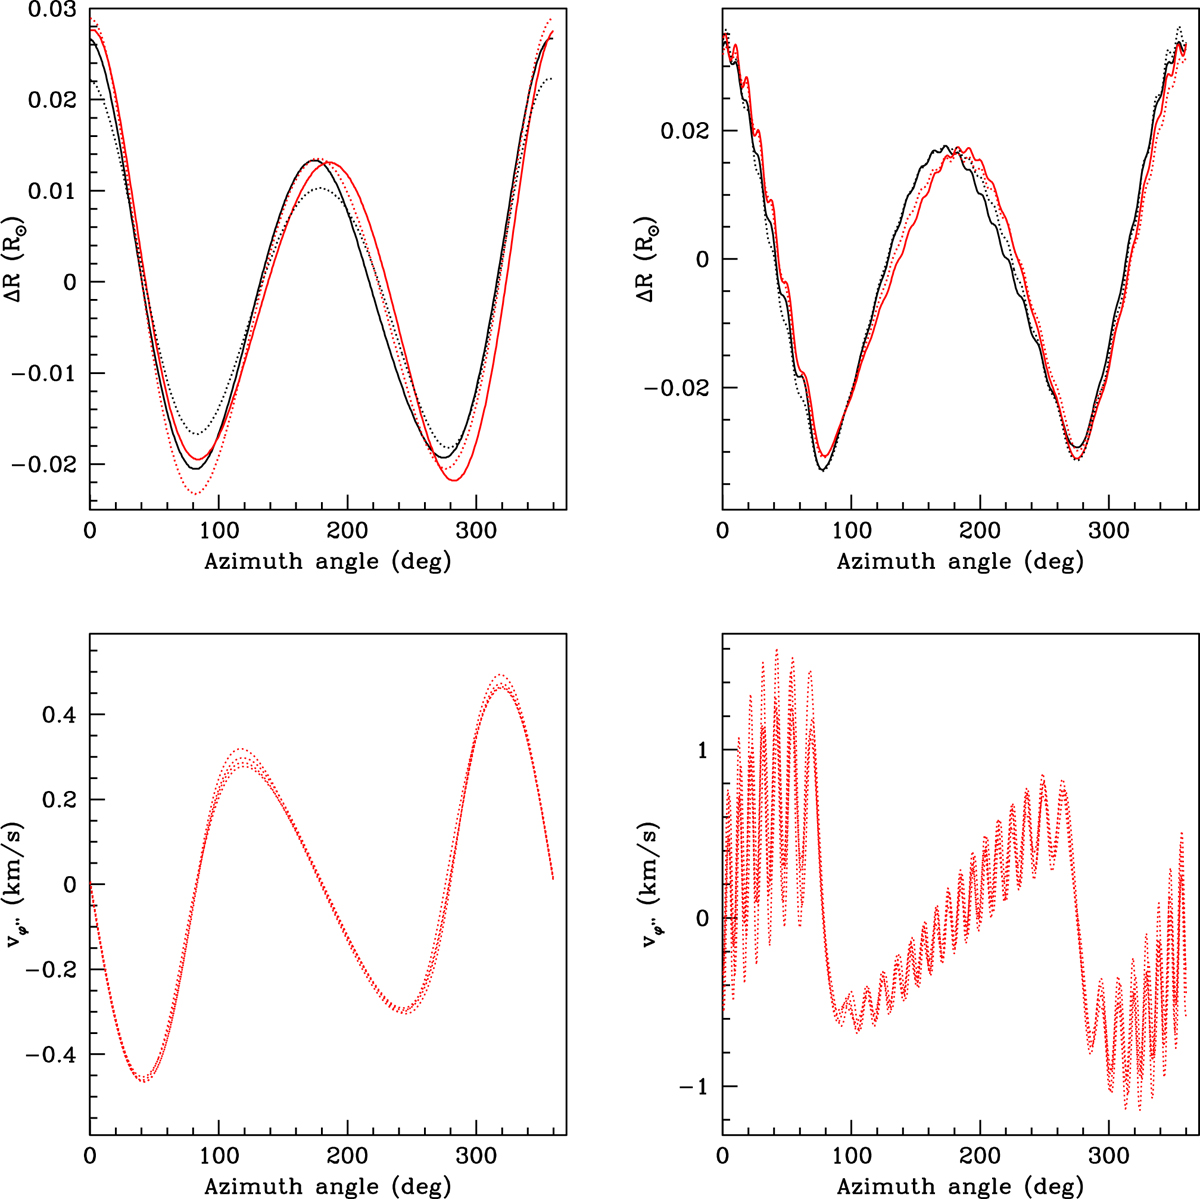
Fig. A.3.
Download original image
Results of calculations with the one-layer TIDES model using input parameters corresponding to those listed in Table A.1. Top: Surface deformation at the equator for the analogous Case 1 model (left, β0 = 1.8) and the analogous Case 17 model (right, β0 = 0). Black and red curves indicate different times within the same orbital cycle. Bottom: Radial component of the tidal velocity for each of the models shown in the top panels.
Current usage metrics show cumulative count of Article Views (full-text article views including HTML views, PDF and ePub downloads, according to the available data) and Abstracts Views on Vision4Press platform.
Data correspond to usage on the plateform after 2015. The current usage metrics is available 48-96 hours after online publication and is updated daily on week days.
Initial download of the metrics may take a while.