Fig. 4.
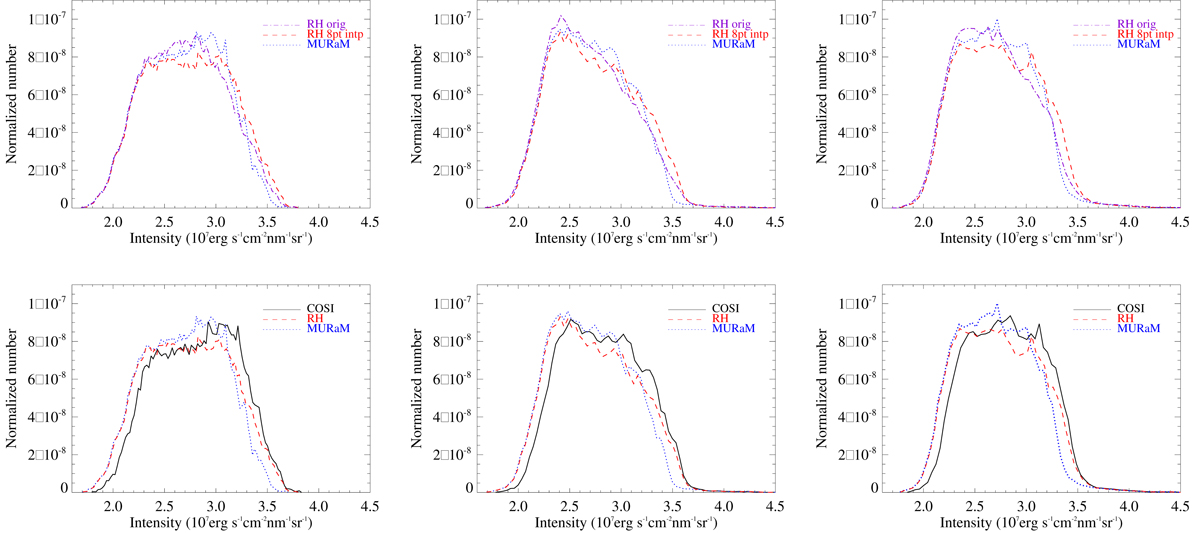
Download original image
Top panel: intensity distribution function for the full 384 × 384 snapshot calculated with the RH code using the original grid in the MHD simulation (purple dot-dashed lines) and the 8-point interpolated MHD grid (red dashed lines) and the MURaM calculation (blue lines). Bottom panel: intensity distribution function for the HD (left panel), 100 G (middle panel) and 200 G (right panel) snapshots using the COSI (black lines), MURaM solver (blue lines), and RH (red lines) codes.
Current usage metrics show cumulative count of Article Views (full-text article views including HTML views, PDF and ePub downloads, according to the available data) and Abstracts Views on Vision4Press platform.
Data correspond to usage on the plateform after 2015. The current usage metrics is available 48-96 hours after online publication and is updated daily on week days.
Initial download of the metrics may take a while.